


Kubernetes is a container orchestration platform that helps you effectively manage and deploy your containerized applications in multiple server environments.
It lets you scale your application up or down on multiple servers when traffic suddenly increases or decreases rapidly. Your organization can save a lot of time and money when Kubernetes is configured properly.
Kubernetes cluster monitoring is specifically targeted at monitoring the resources your applications use in each cluster. These resources include CPU, memory, and storage. In addition, monitoring your Kubernetes cluster ensures you have up-to-date pod processes and that containers in your pods aren’t repeatedly crashing and restarting. It also makes sure you have sufficient nodes to run your pod processes.
In this article, you’ll learn about different options for monitoring a Kubernetes cluster deployed using Azure Kubernetes Service (AKS). You’ll learn what to expect from monitoring, what technical tools are available within it, and what unique features the platform has.
Why it’s important to implement a monitoring stack
A monitoring stack is a set of tools that includes logging, visualization, and alerting. They work together to inform and provide insights into your Kubernetes clusters. These insights include detailed information about the availability of your application, the resources your application consumes, the health of your servers, and more.
There are several monitoring stacks in the Kubernetes ecosystem, including Prometheus; Grafana; Alertmanager; Elasticsearch, Logstash, and Kibana (ELK) stack.
There are so many reasons for monitoring your Kubernetes cluster, such as ensuring your application is running in its preferred state and monitoring the consumption of resources your container is consuming to ensure peak performance. You’ll learn more about the importance of classic monitoring and Kubernetes-specific monitoring below.
Classic monitoring
Classic monitoring includes monitoring the availability of your application, the resources that your application consumes, and your application’s health and performance.
Availability
When you monitor the availability of your application, you ensure that your application is running in an excellent state.
By default, if your containerized application crashes, Kubernetes automatically restarts the pod. However, there are scenarios that will cause your application container to continue crashing. When any of your containers are in this state, it affects the overall performance of your Kubernetes cluster because the container pod won’t be able to receive requests when the application container is in a failed state.
Resources and consumption
When you monitor your application resources and consumption, you’re provided with insights into the available resources in your cluster. As your application traffic increases, it consumes more resources; and when it doesn’t have enough resources to consume, your application performance will be affected. These resources include CPU, memory, network, and storage.
When you know the consumption rate of your application, you can provide more resources to meet your application’s demand or reduce the available resources to save money.
Health and performance
Monitoring application health and performance provides insights into the overall perspective of your application’s health, speed, and performance. These insights include the request rate and response time of your application, the error rate, the network latency, and so on. It also provides the application bandwidth consumption, showing you the sent and received data packets, and the bandwidth the application uses.
When you have excellent insights into your application performance, you can tweak it to ensure your app performs better and has a higher metrics score, which translates to happy users.
Kubernetes-specific monitoring
Kubernetes-specific monitoring includes monitoring the deployment status of your application, node health and performance, resource distribution to all pods, resource usage of nodes and pods, availability of pods, control plane, and node access of the Kubernetes cluster.
Node health
Nodes are the virtual environment where your pods’ processes run. When you scale up your application, Kubernetes creates more pods and then schedules them in available nodes. However, if the node is unhealthy, the performance of the pod and all the pods assigned to it are affected as well as the overall performance of the application.
A node can be unhealthy for several reasons. If the communication between the control plane and the node is broken as a result of misconfiguration of routing and network rules, it’s considered unhealthy. Moreover, a node is considered unhealthy when it’s out of memory or disk space.
Additionally, a failed node cannot host pods. By monitoring the health of your nodes, you can get information about their health and the available resources in your cluster base.
Pod deployment status
There are several reasons a new deployment can fail, including errors in pulling your application image, insufficient permissions, error in your application runtime configuration, failed readiness probes, and invalid resources quota assigned to your pods’ definition.
However, monitoring your deployment status ensures that you can deploy quick fixes before it affects end users. It also gives you the opportunity to roll back to a previous deployment before all your users experienced the errors.
Kubernetes cluster resources
The resources in your Kubernetes clusters determine how well your applications will perform. A shortage of the required resources for your application specifications, unhealthy nodes, or errors in your container configuration can affect your application, causing it to falter during a spike in traffic.
Your application can also be affected if your Kubernetes components, like your master or worker nodes, are not in a healthy state. It’s important that you monitor your resources and components, like the health of your master and worker nodes, and the number of pods running to ensure that you have enough nodes to handle your pods’ requirements.
Control plane
The control plane is the brain of the Kubernetes cluster. The components include the Kubernetes API server, etcd, scheduler, and controller managers. Monitoring the control plane allows you to quickly diagnose scheduling and orchestration issues that may occur with your control plane components.
It also provides insights on your server workloads and resources, like the number of requests initiated in your cluster, the number of running kubelet instances, the API server request rate and latency, and the healthy and unhealthy nodes in your cluster.
Built-in option for monitoring Kubernetes on AKS
AKS, a managed Kubernetes service provided by Microsoft, allows you to deploy and manage containerized applications with ease.
Azure’s built-in monitoring tool, Azure Monitor, is used to monitor the health and performance of your web services and application. It provides features to effectively monitor your Kubernetes cluster, which include container insights, alerts, metrics, logs, diagnostic settings, advisor recommendations, and workbooks.

How to configure azure monitor
When you create your AKS Kubernetes cluster, you have the option to enable Azure Monitor during setup, as seen below:
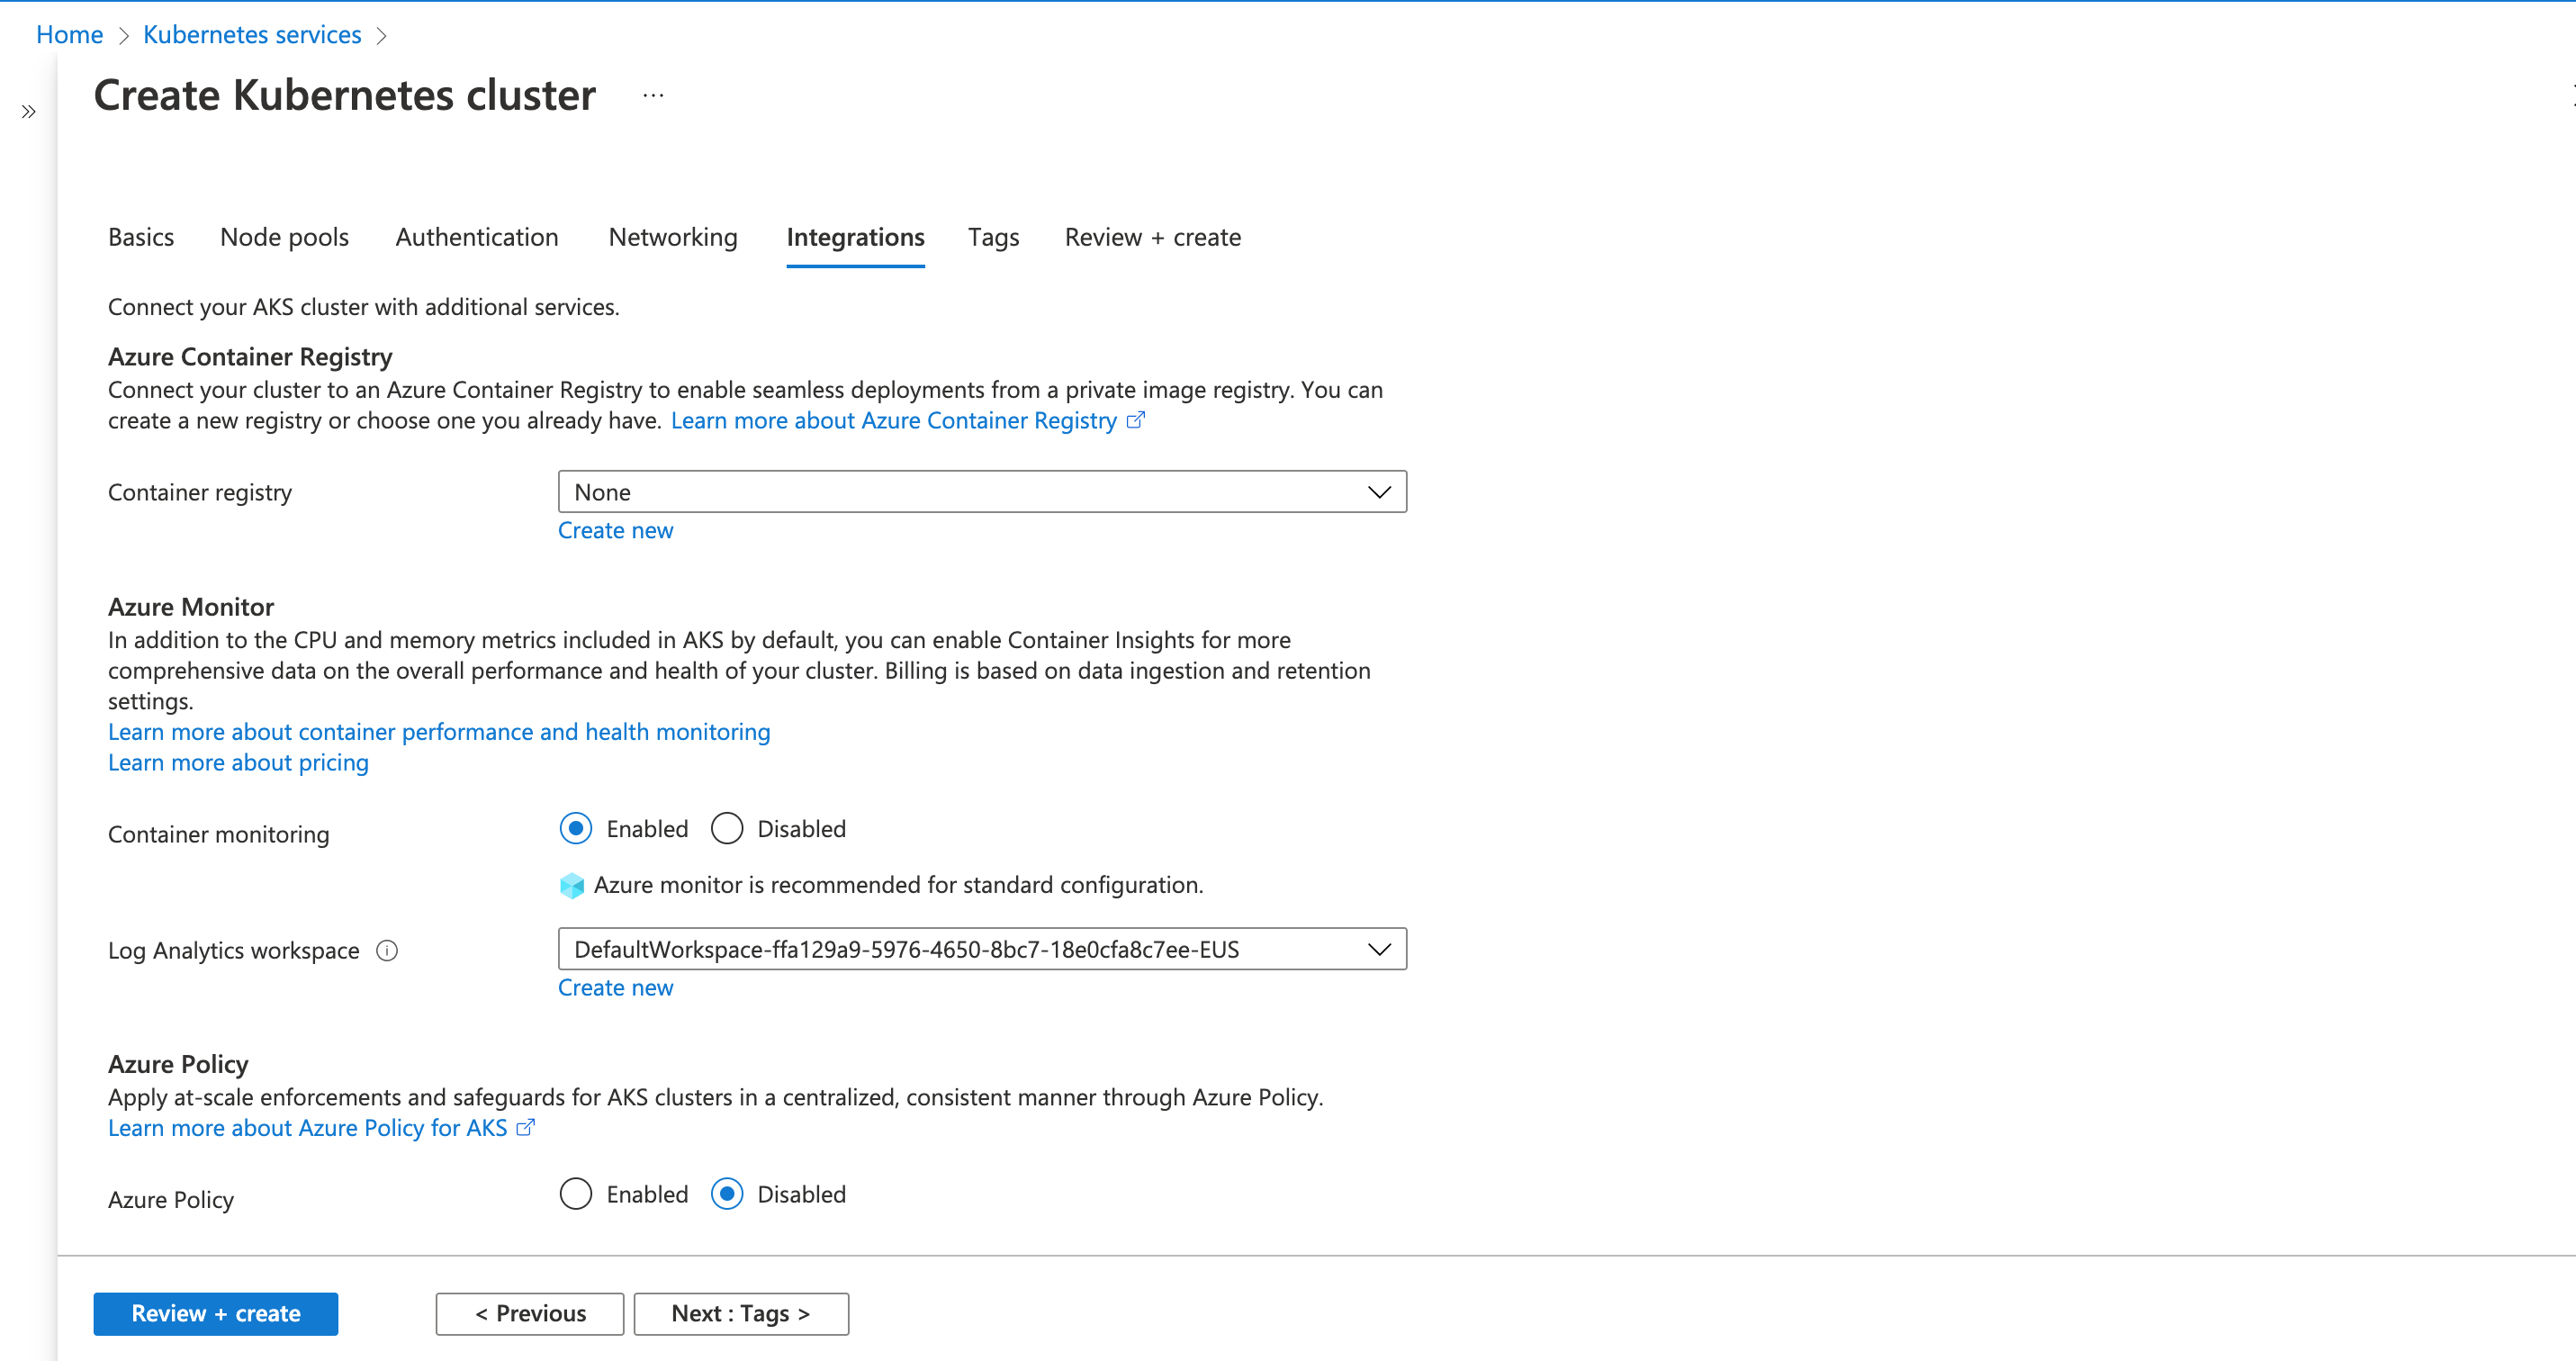
However, if you didn’t enable Azure Monitor when setting up your cluster, then you can follow the steps below to enable it.
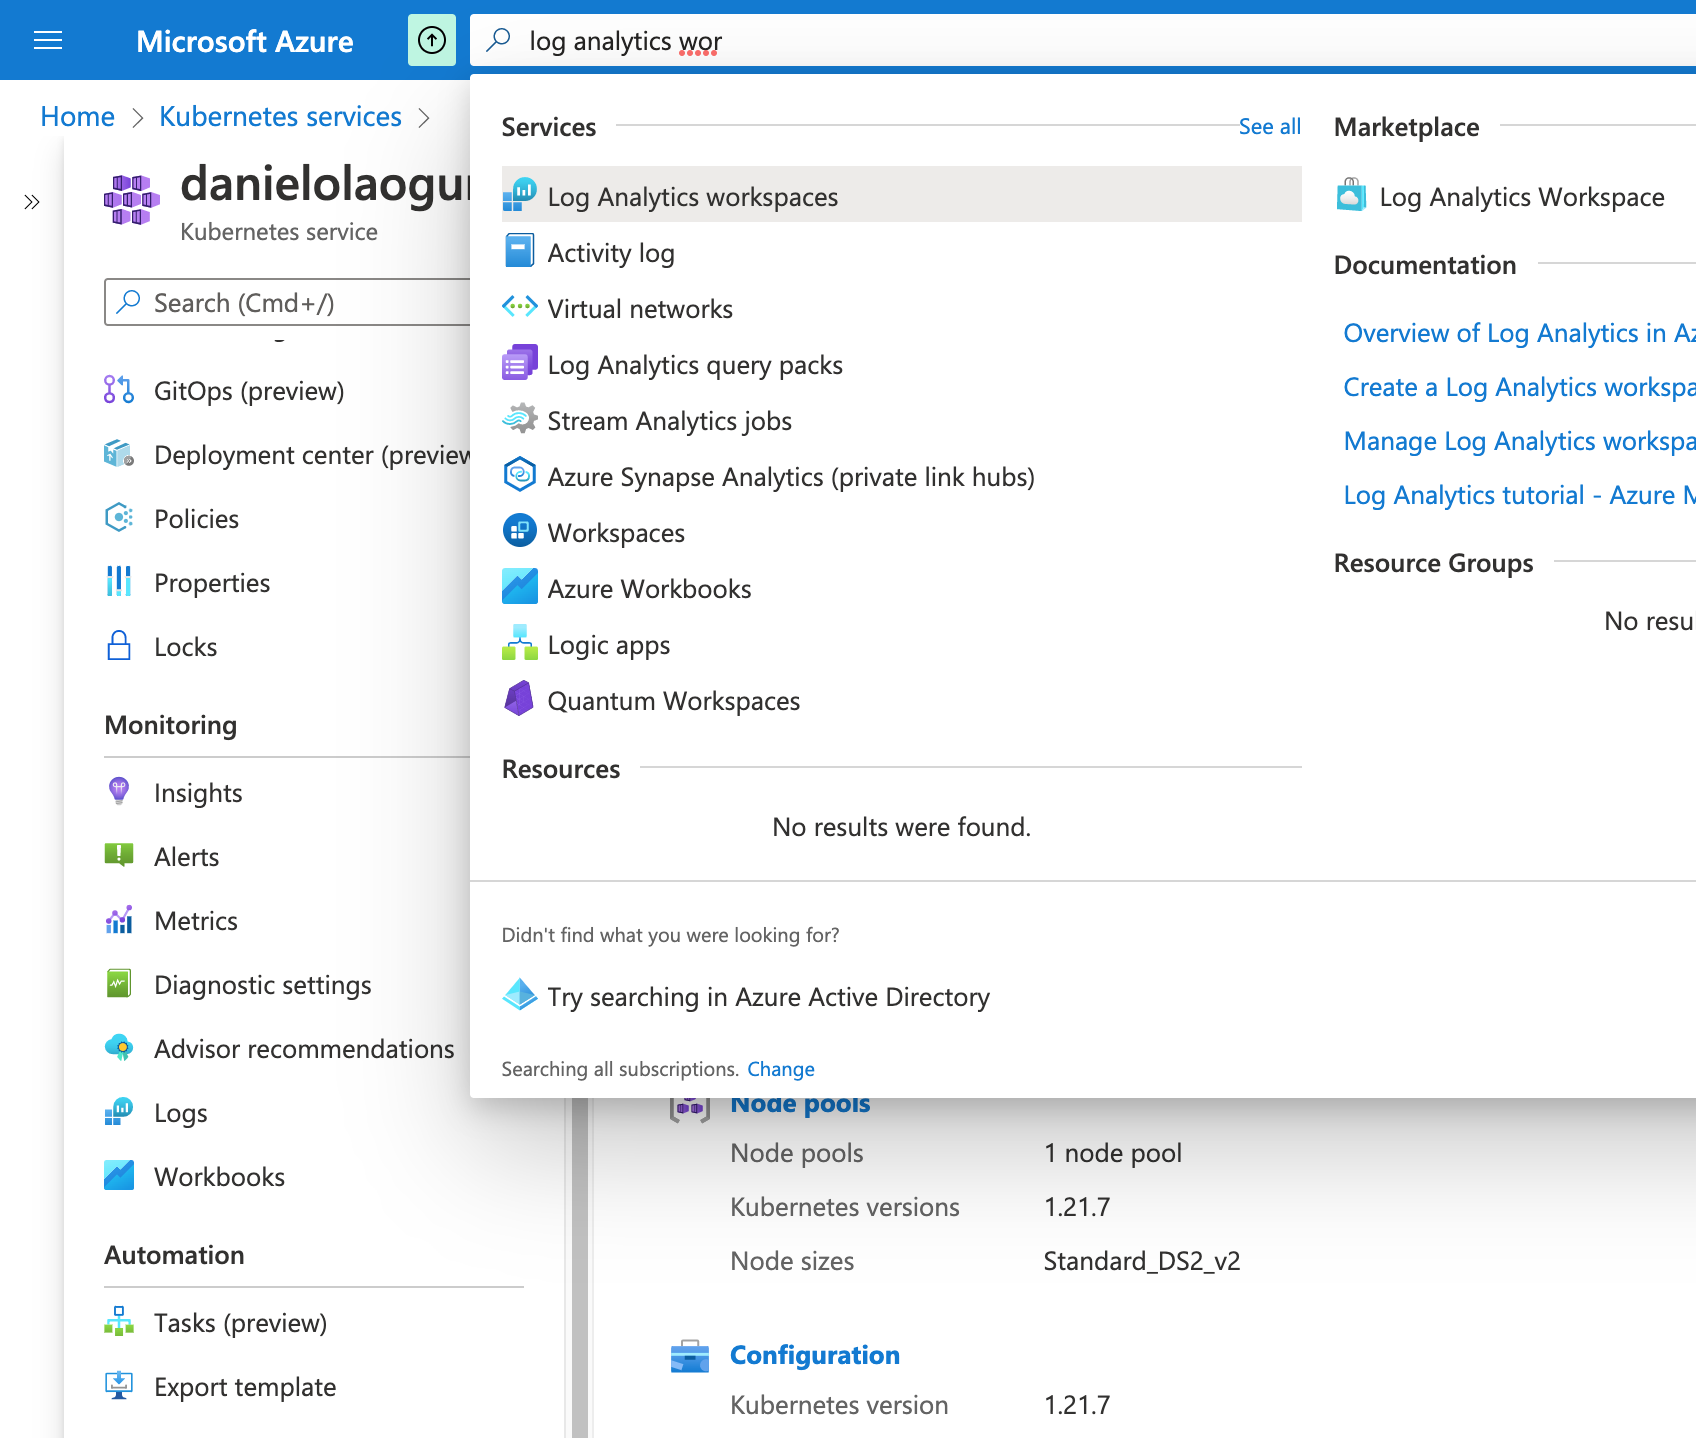
- Log in to your AKS dashboard, and search and select Log Analytics workspaces on the search tab.
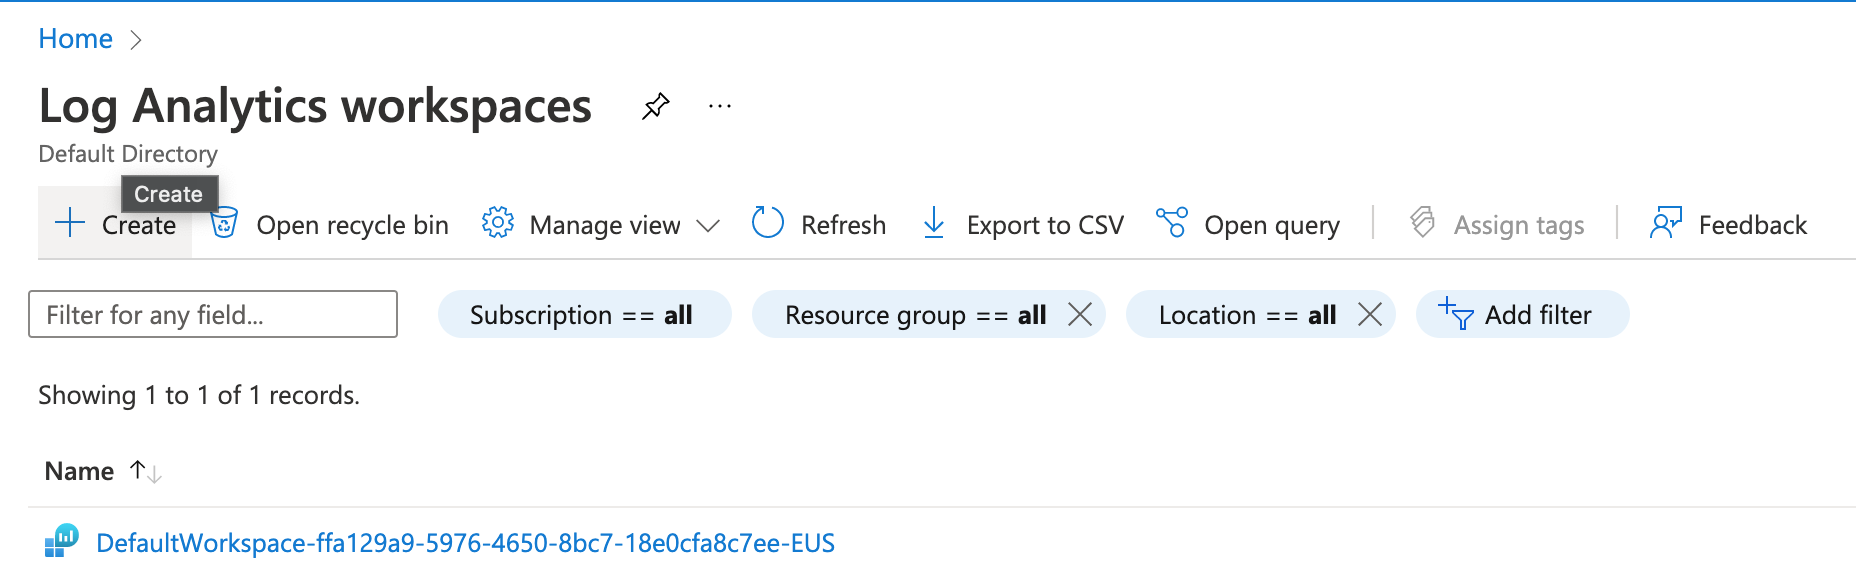
- Click the Create button to create a new Log Analytics workspace.
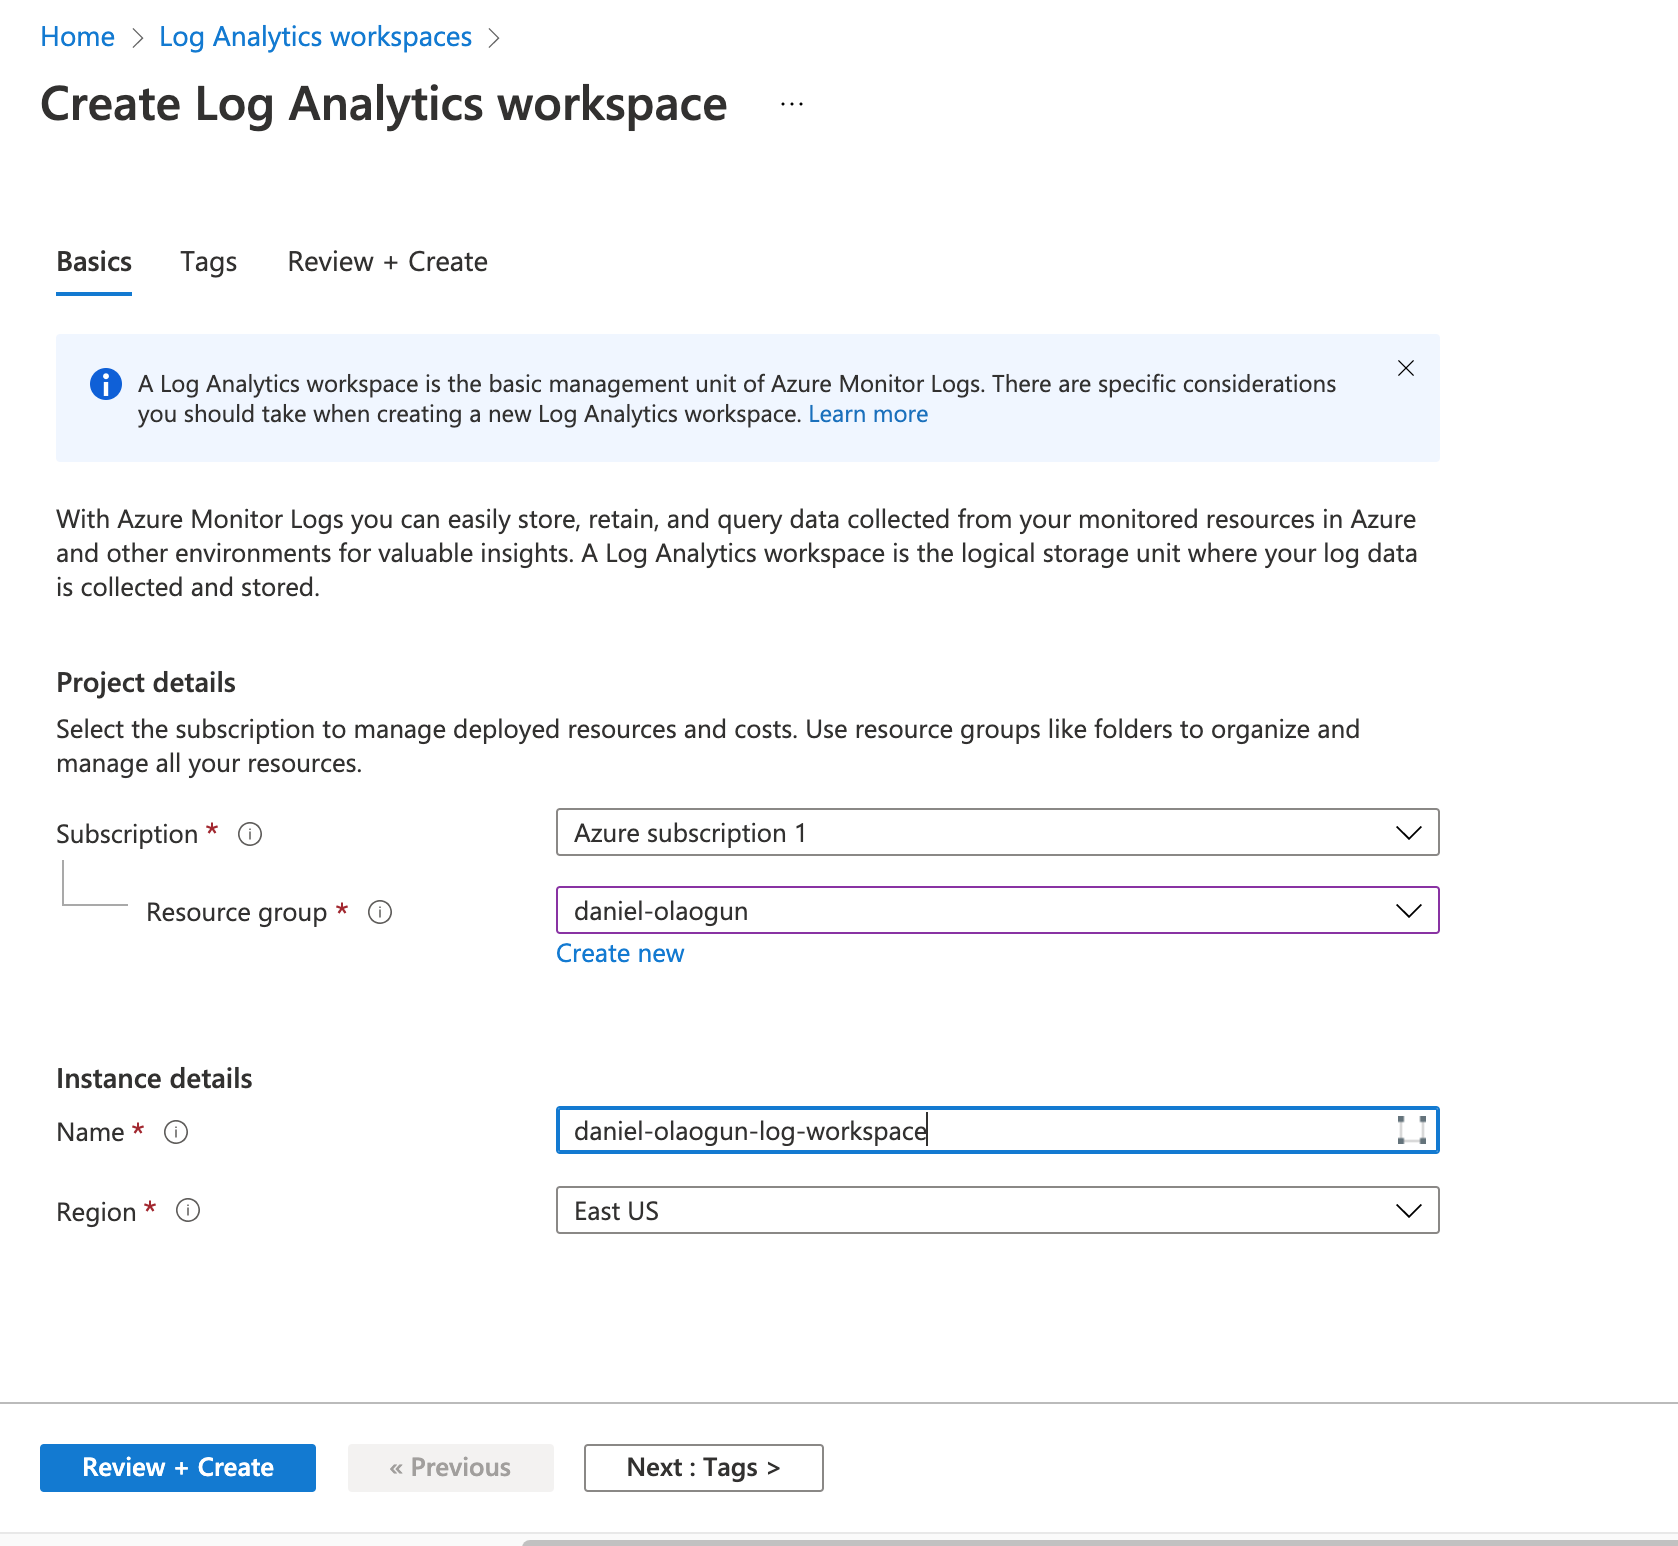
- Fill in the details, then click the Review + Create button.
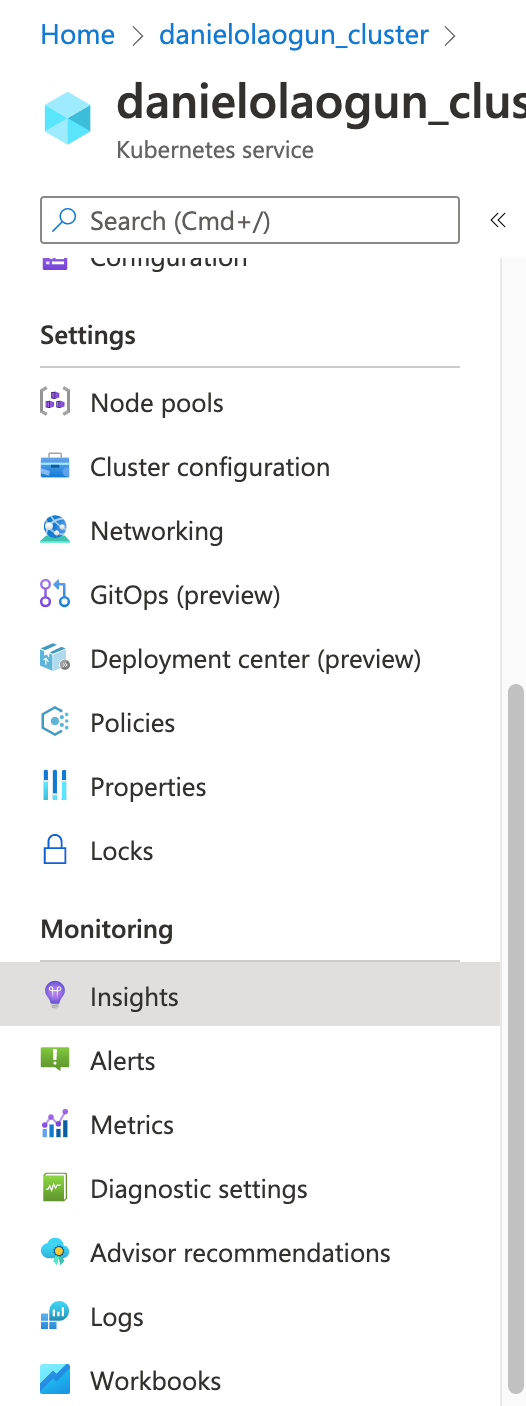
- Once your workspace has been created, return to your AKS dashboard and click on Insights on the left sidebar.
- Click the Log Analytics workspace drop-down and select the new Log Analytics you just created and select the Enable button.
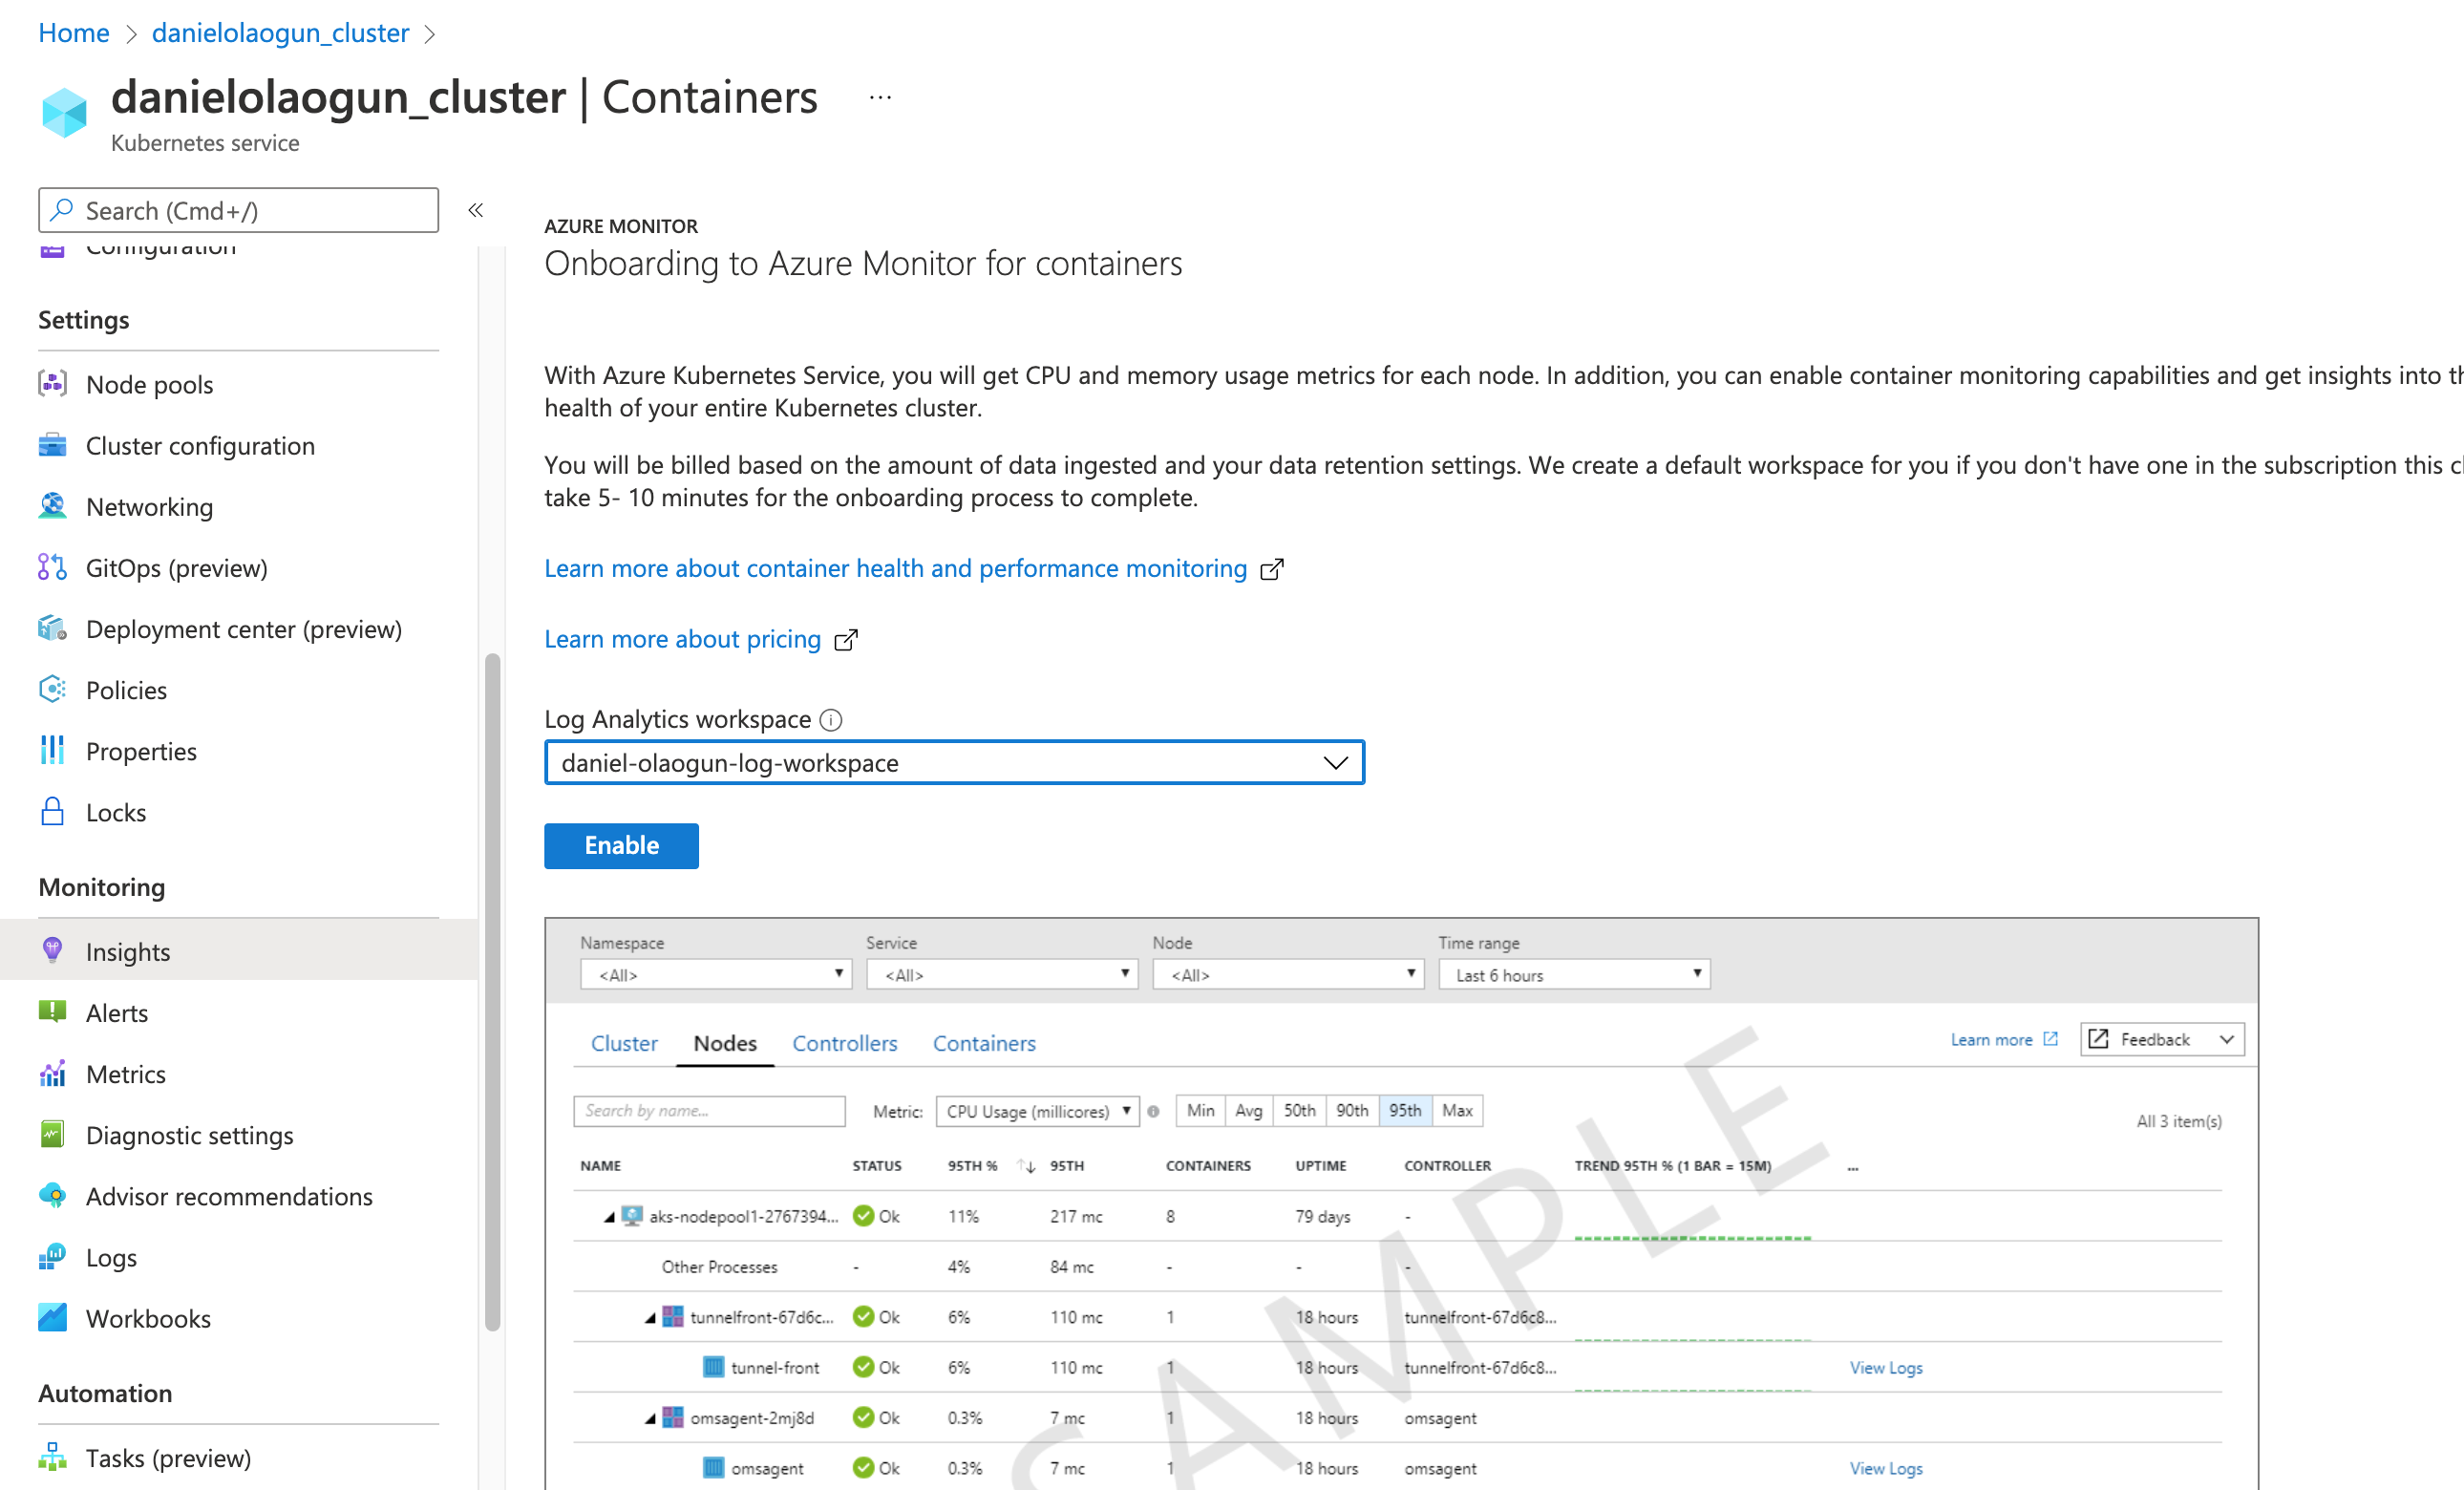
- Once it’s enabled, reload the page to see metrics for your cluster.

Features of Azure Monitor
Azure Monitor has several features you’ll learn about below, including container insights, alerts, metrics, logs, and workbooks.
Container insights
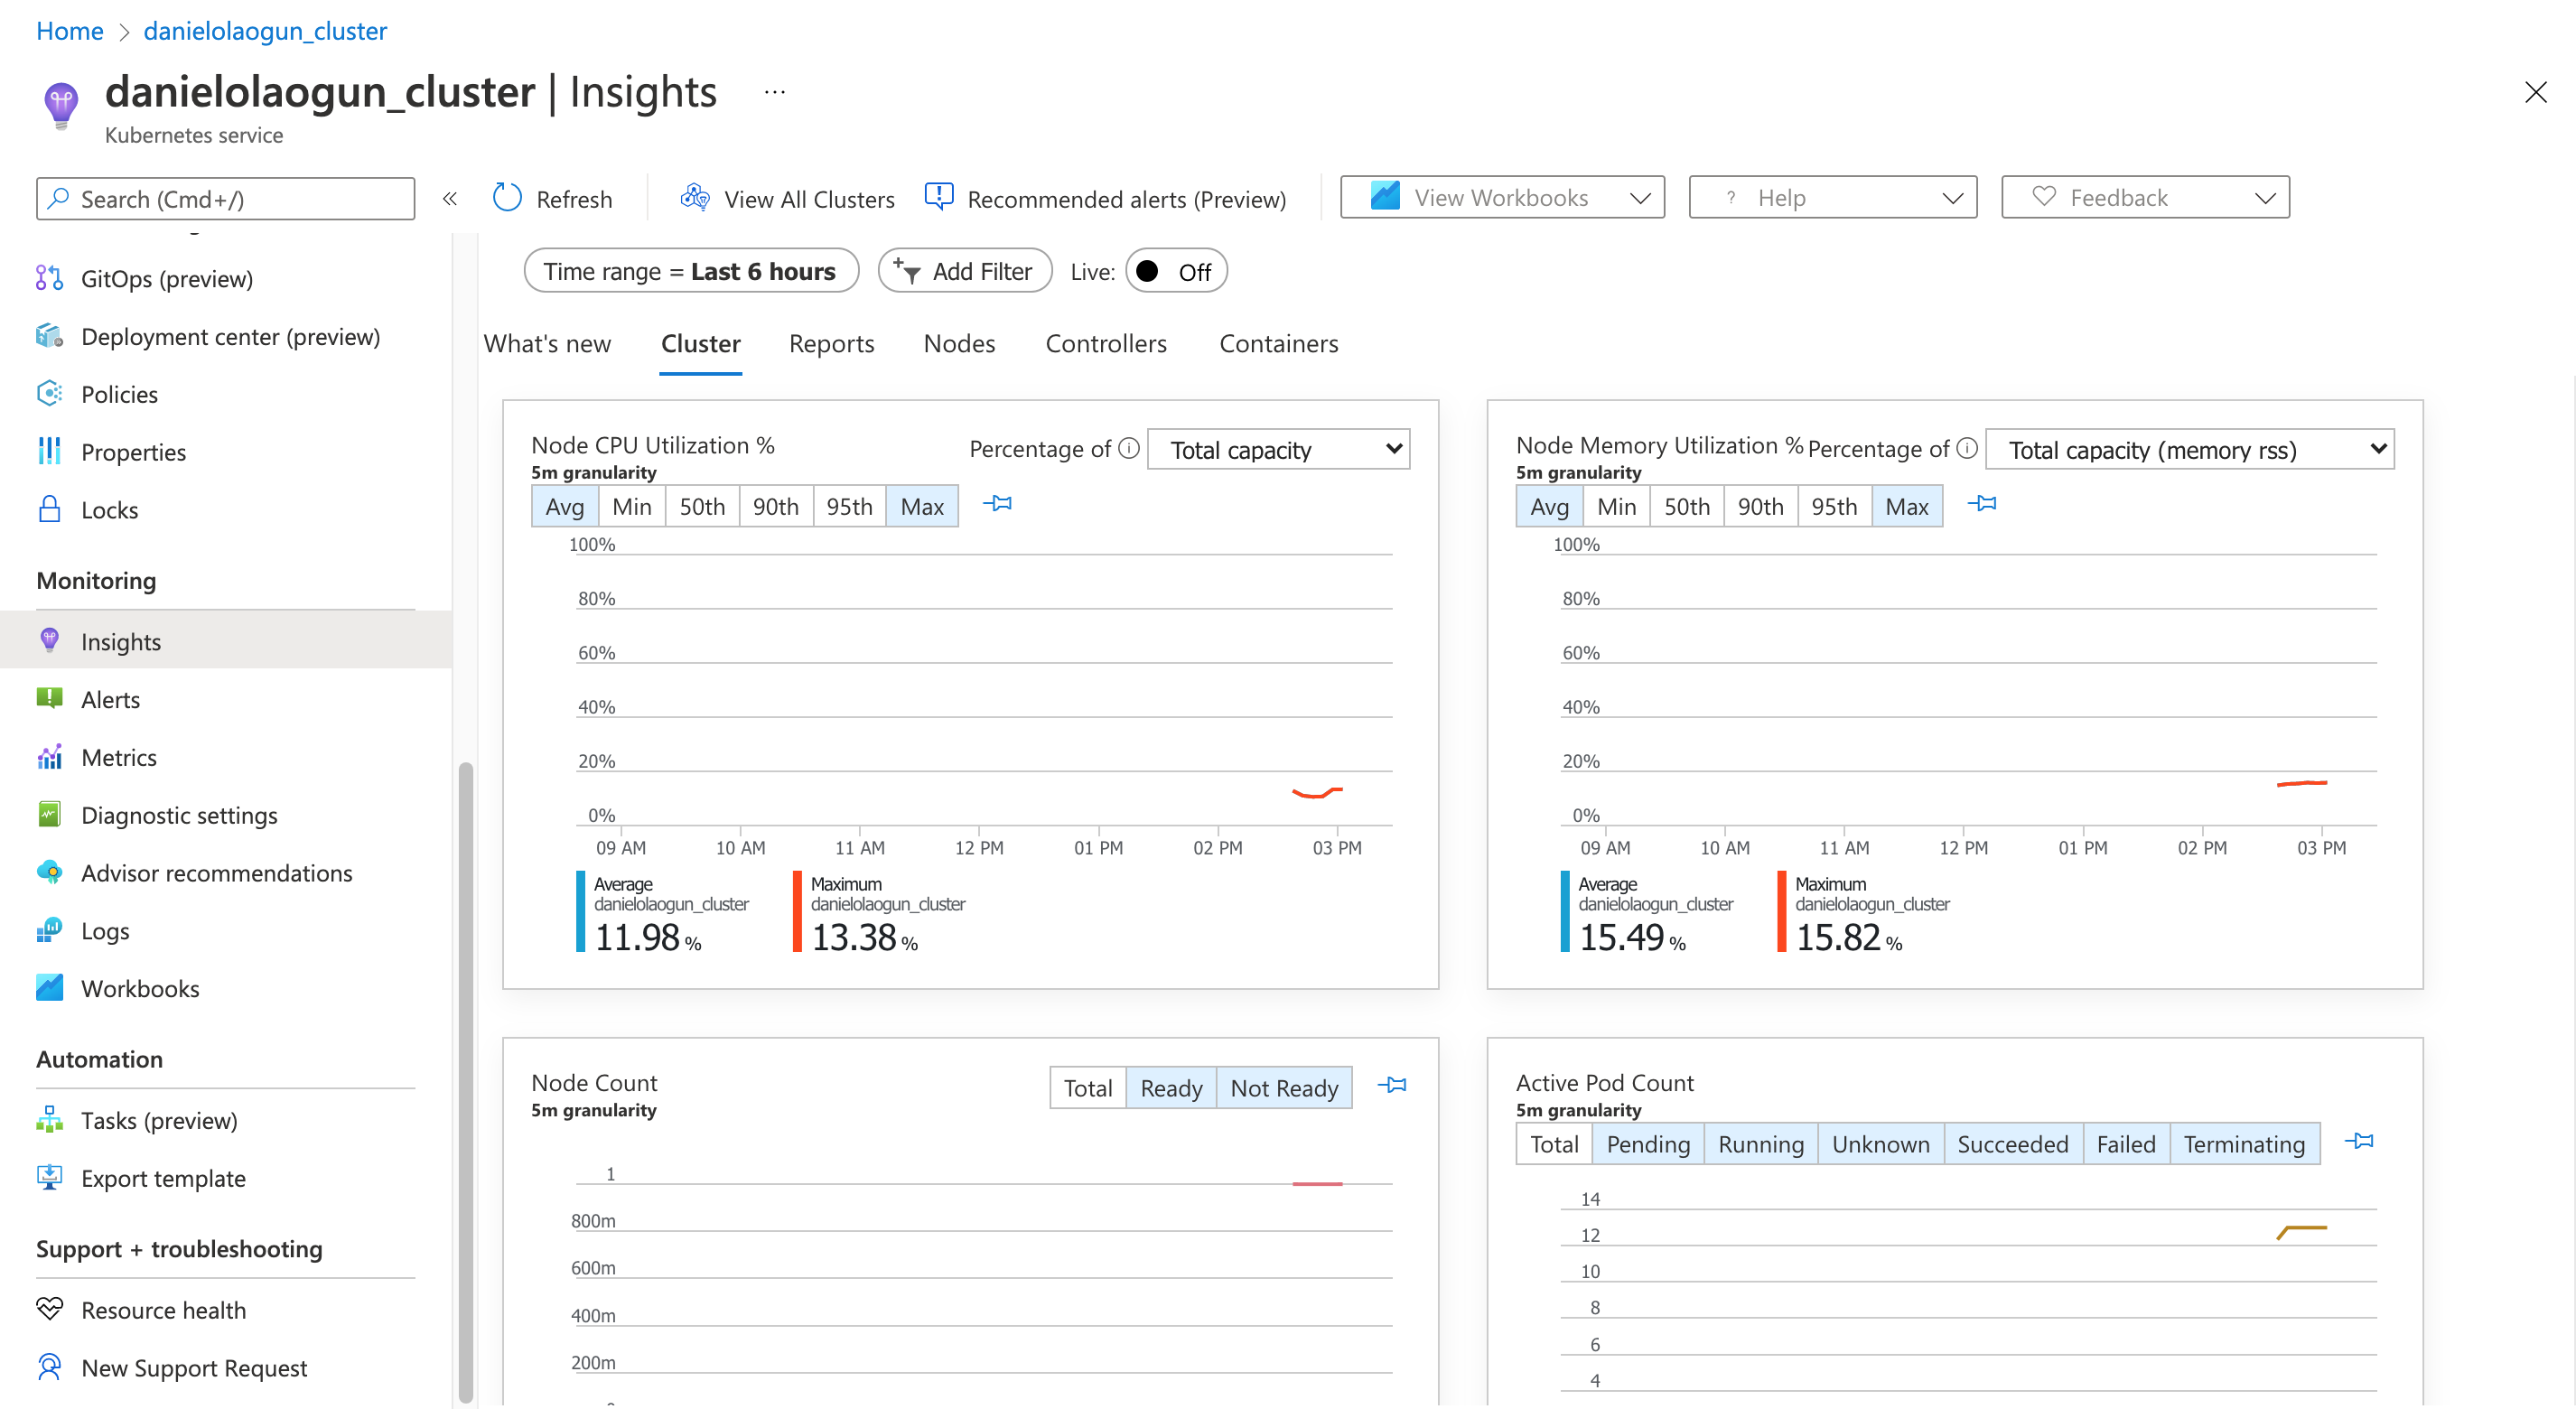
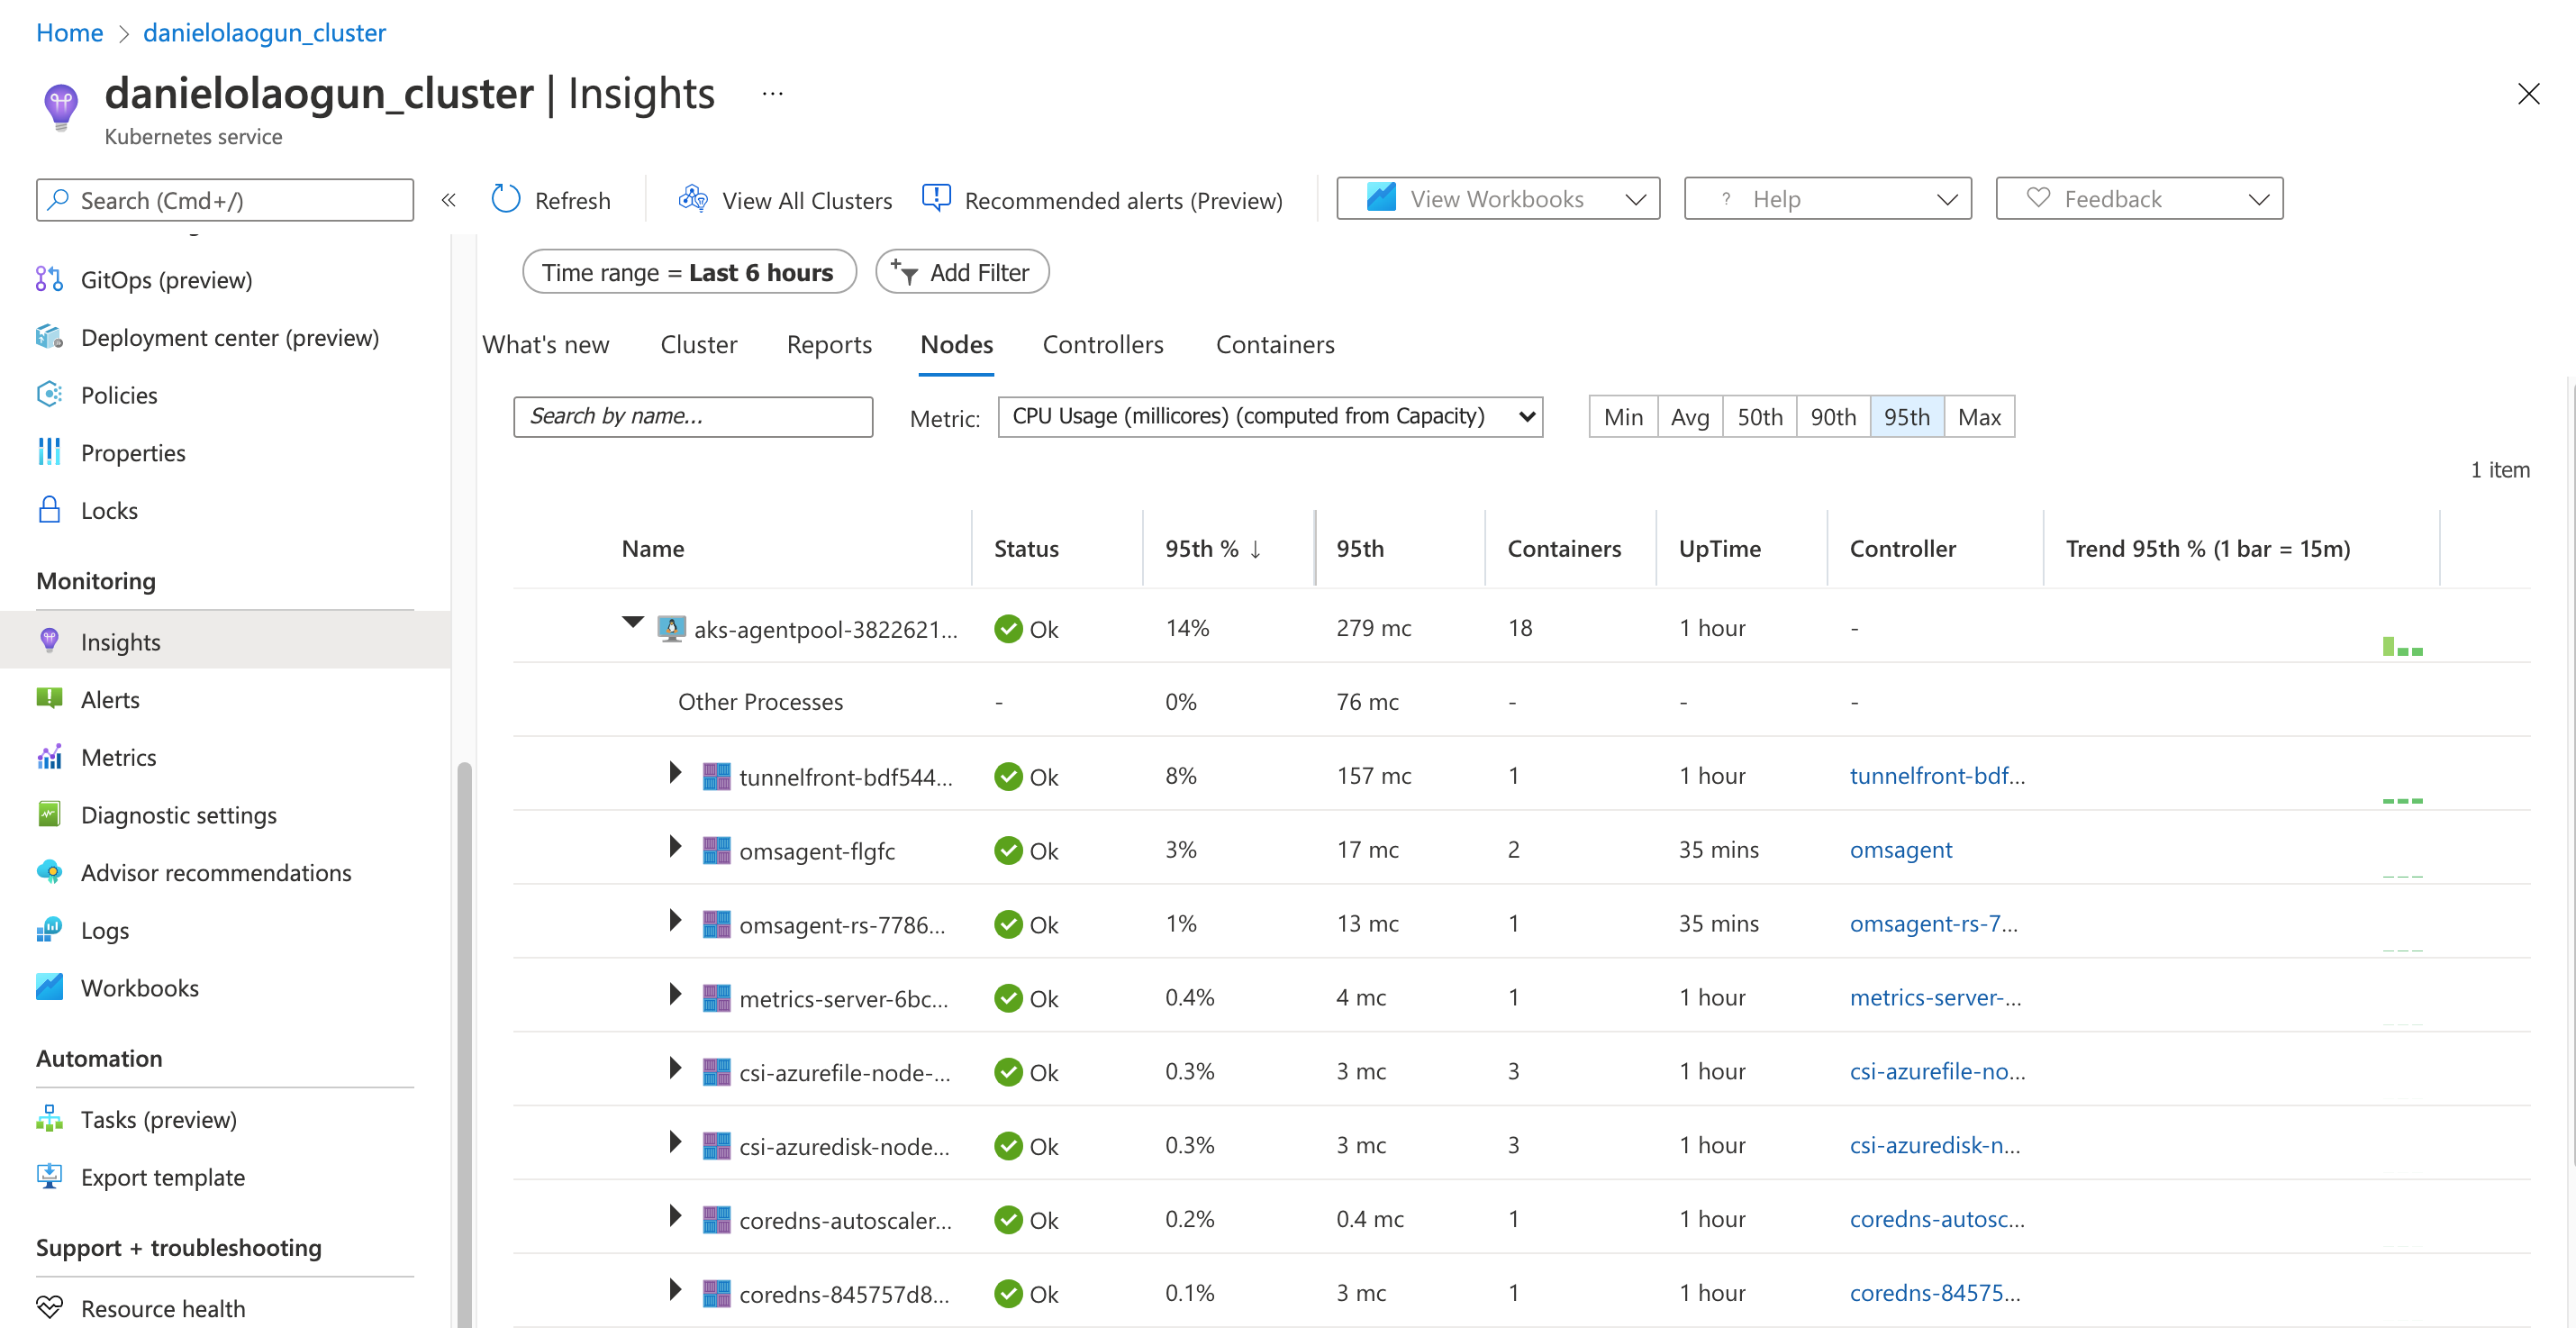
Insights provide you with information and analytics about your cluster. They help you monitor your node resource utilization and container workloads, and give you detailed information about active and failed pods.
Below is a visual representation of the Insights feature in Azure Monitor.
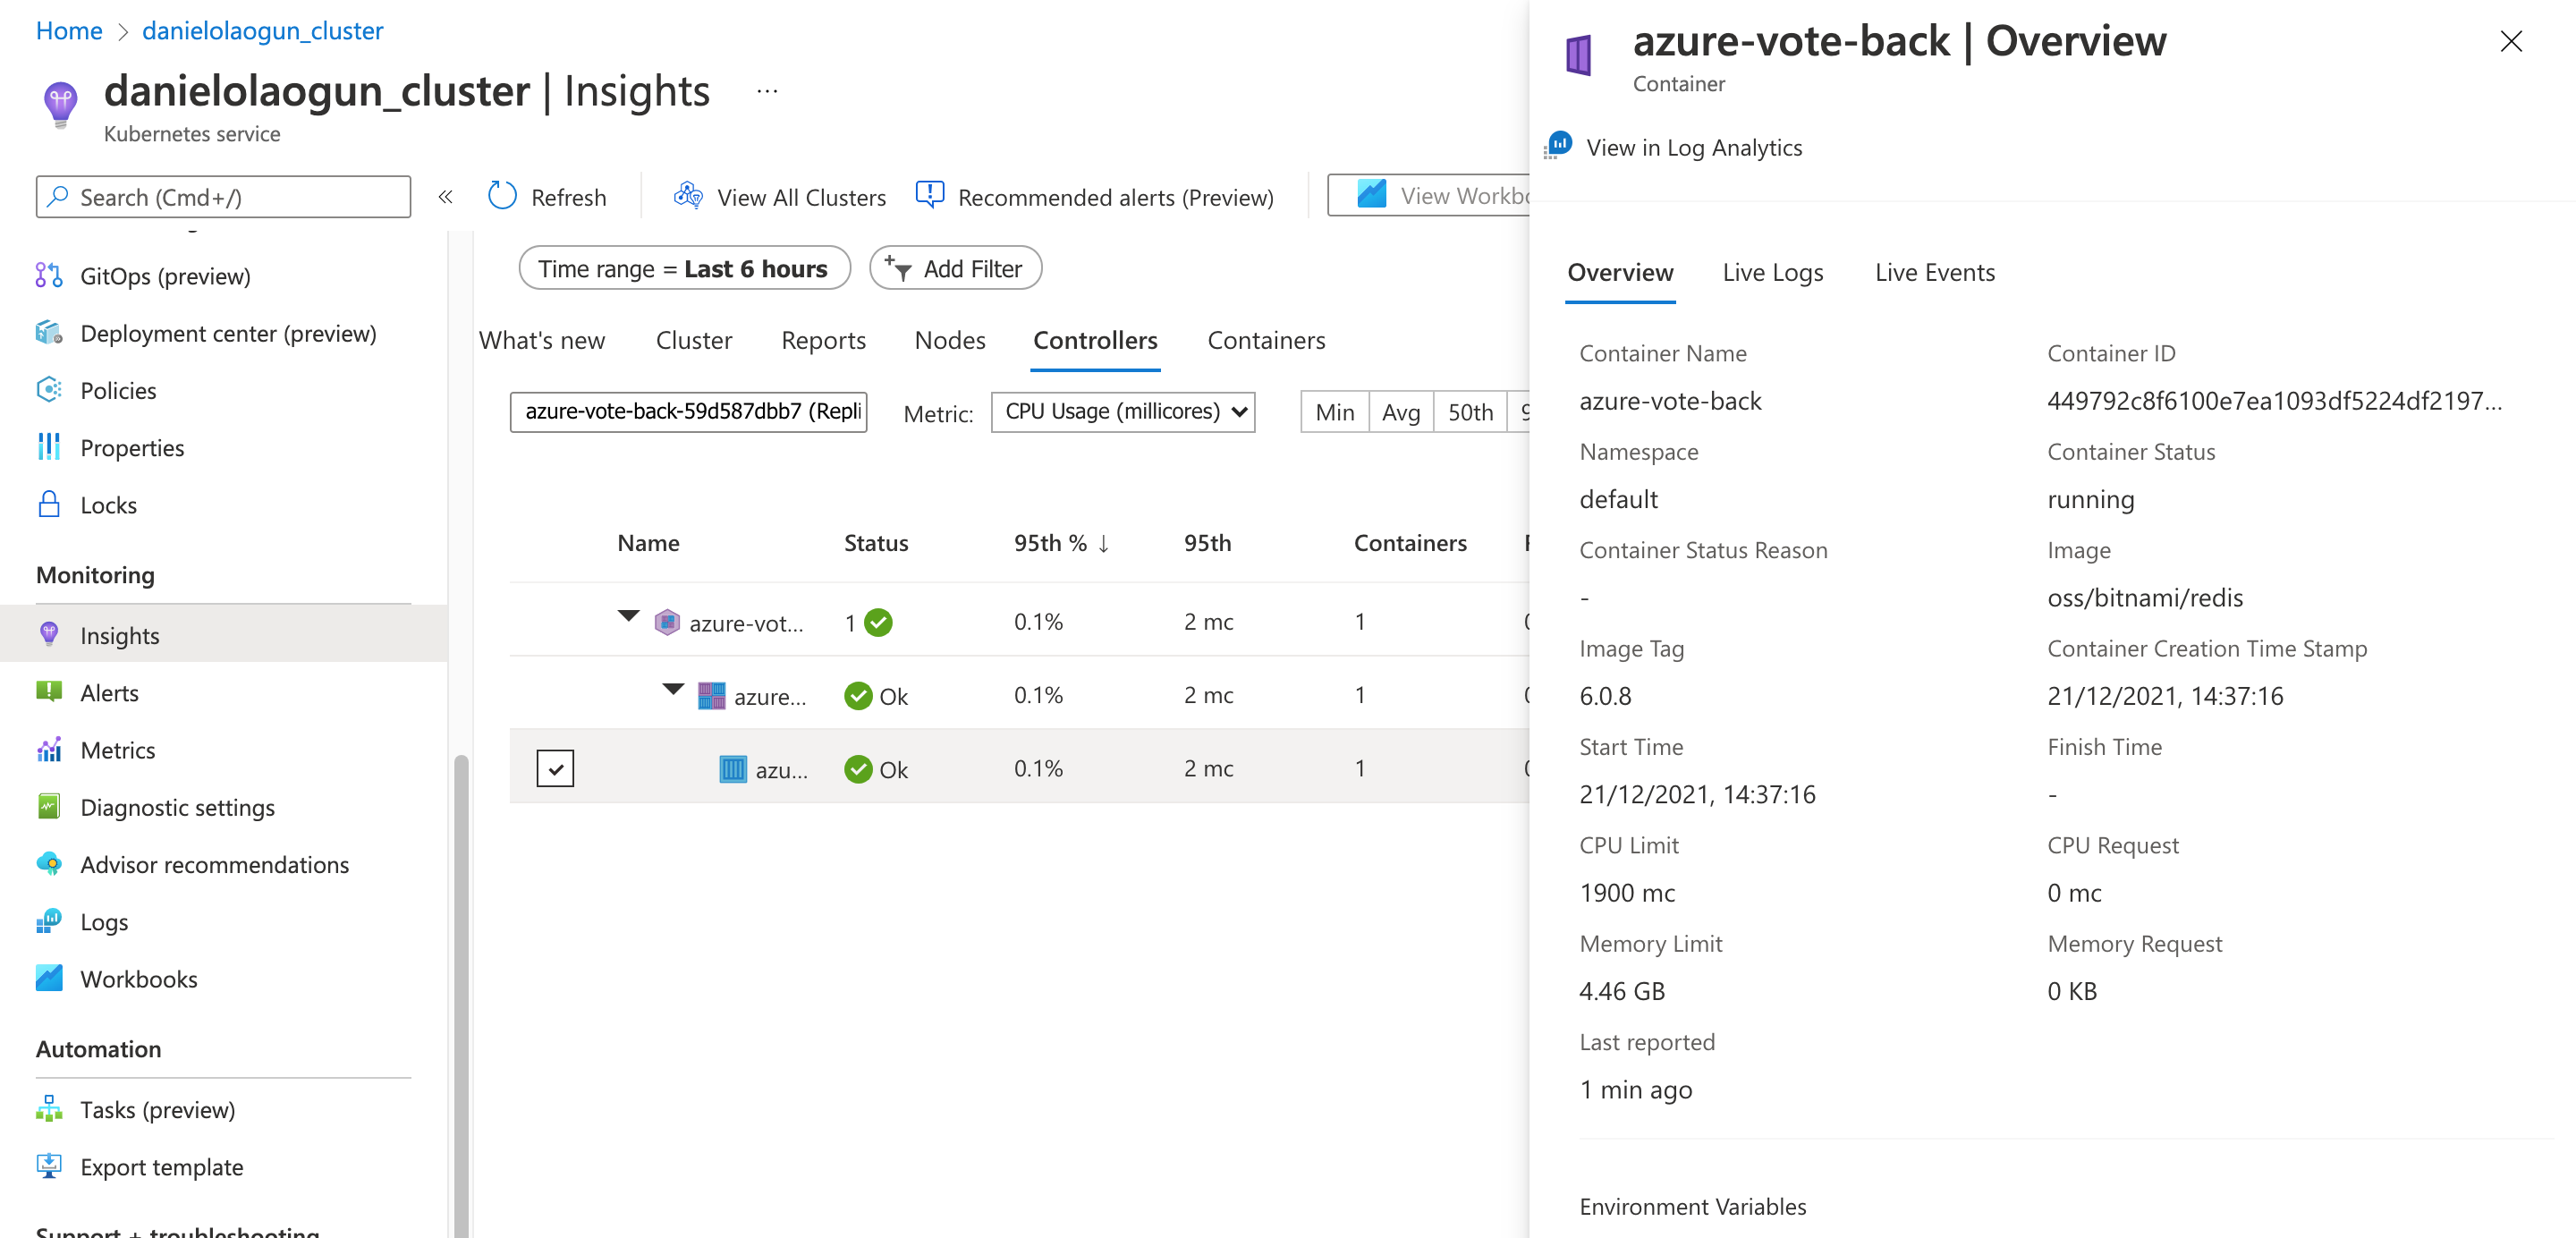
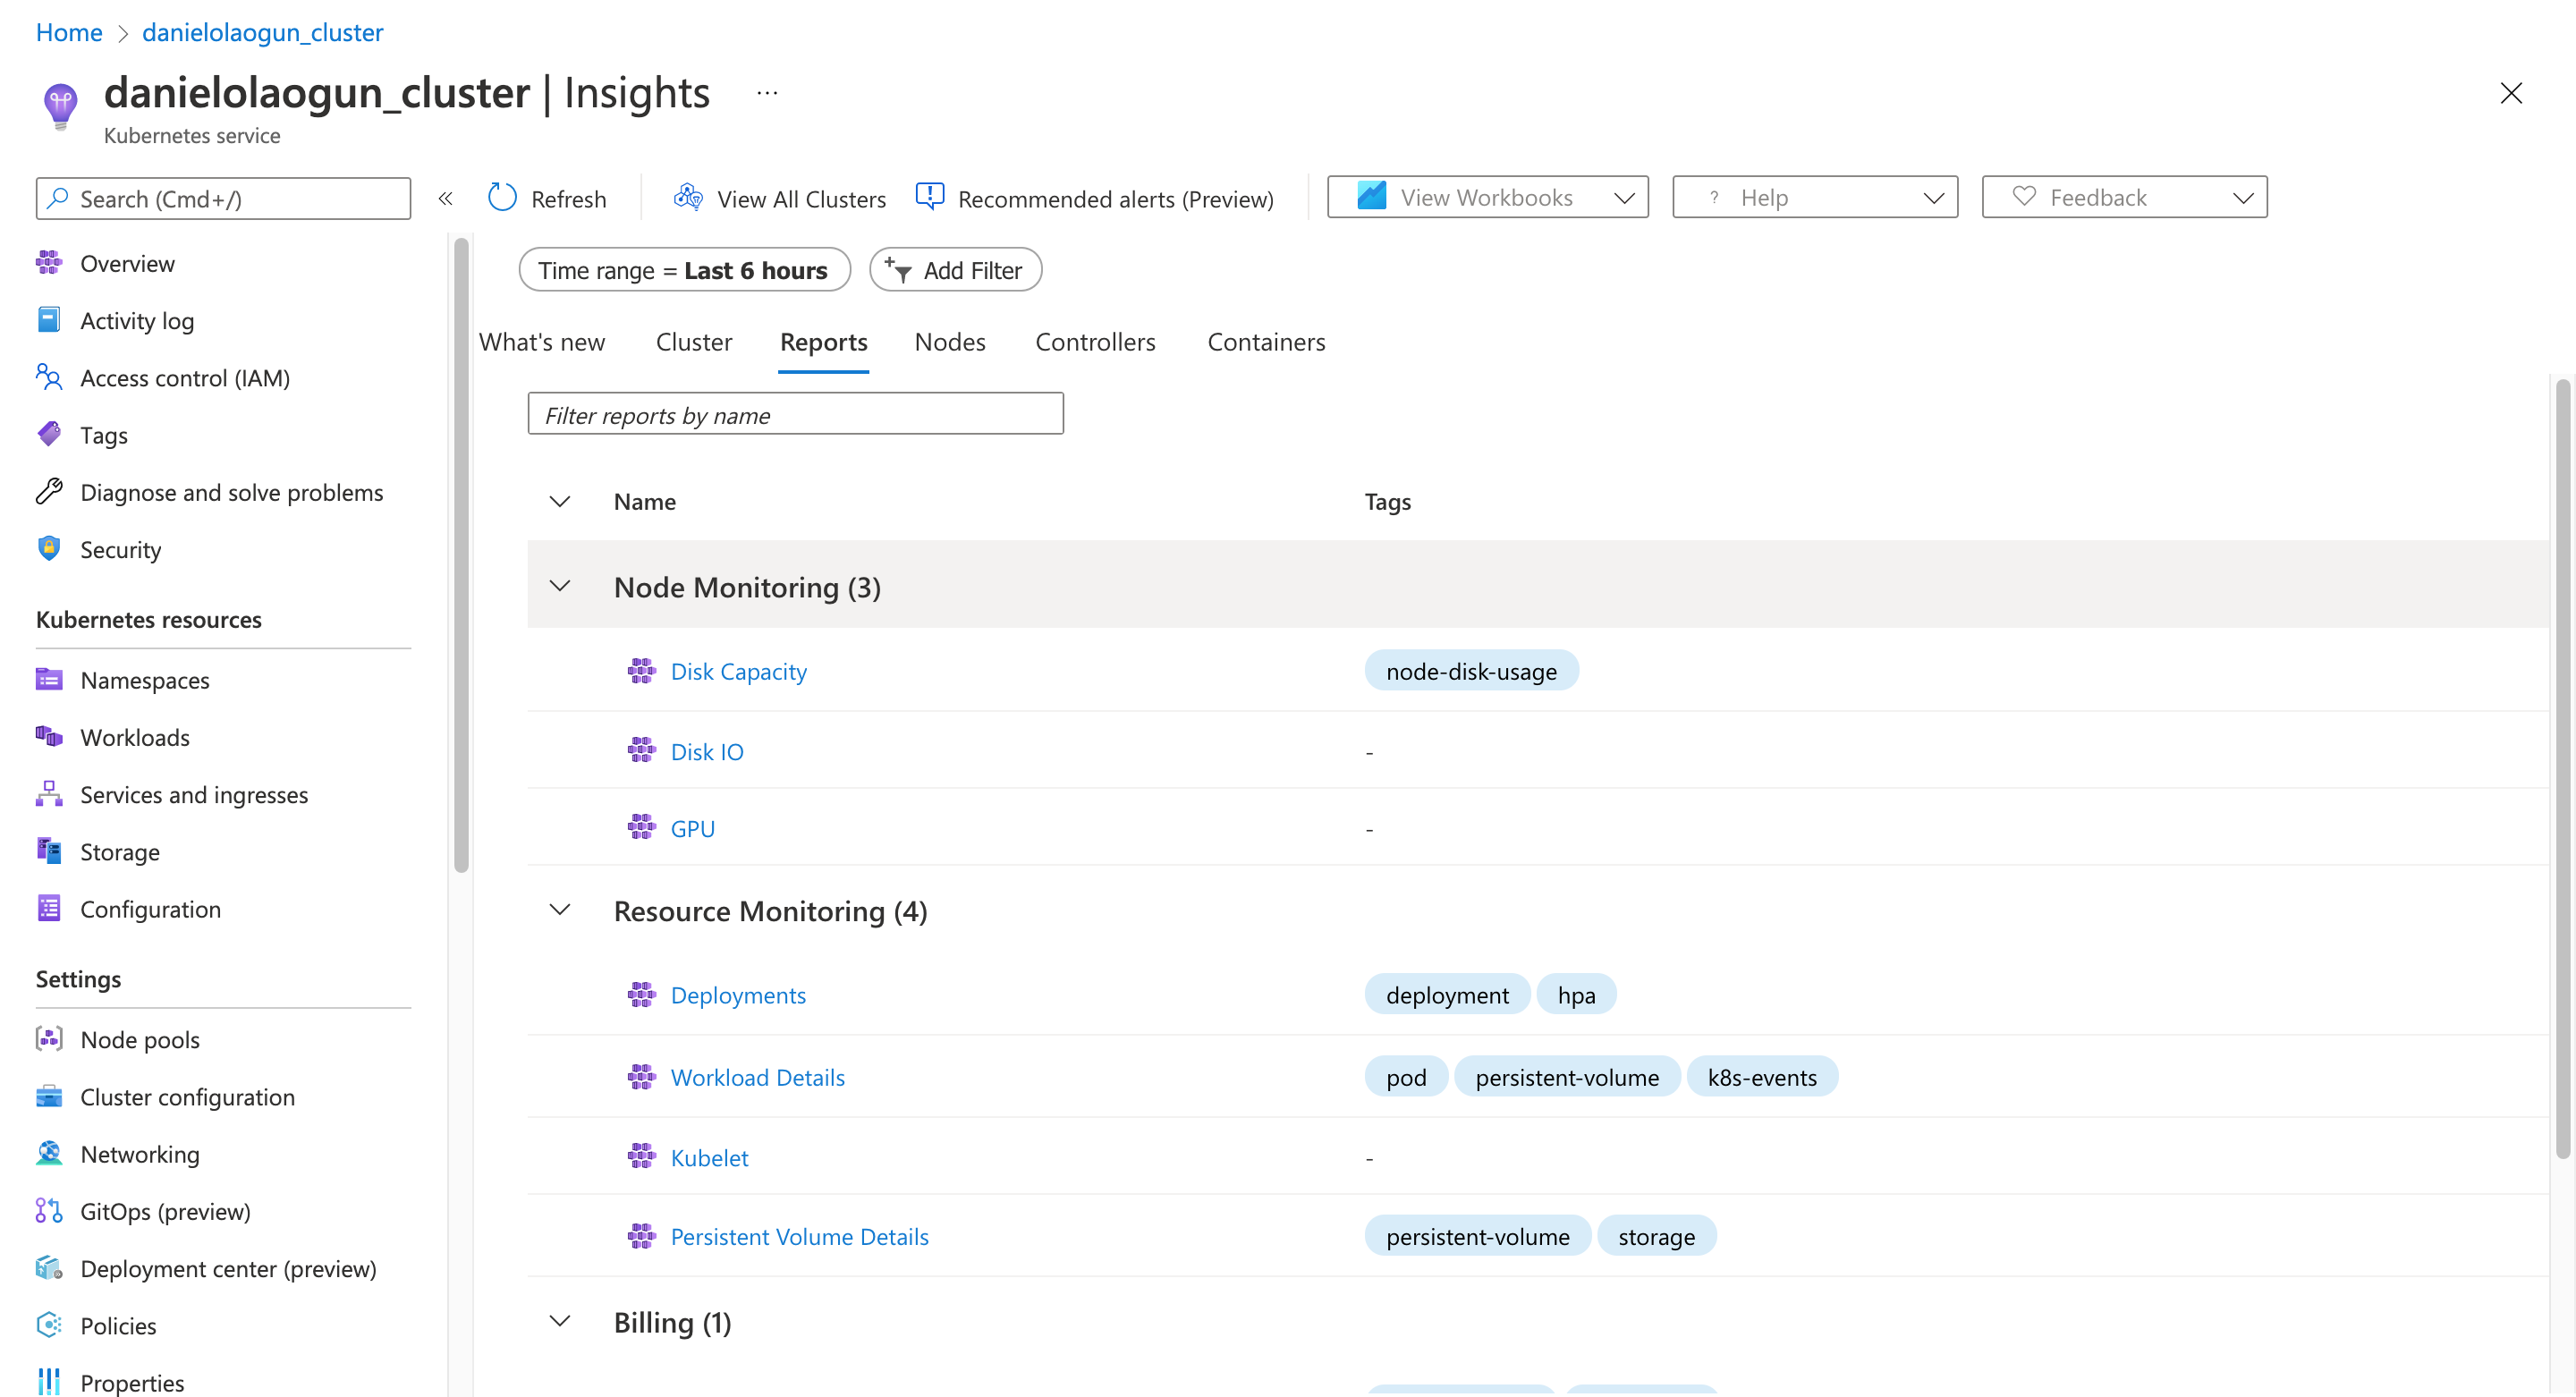
The Reports tab in Insights includes default workbooks provided by Azure that let you view reports about important aspects of your Kubernetes cluster.
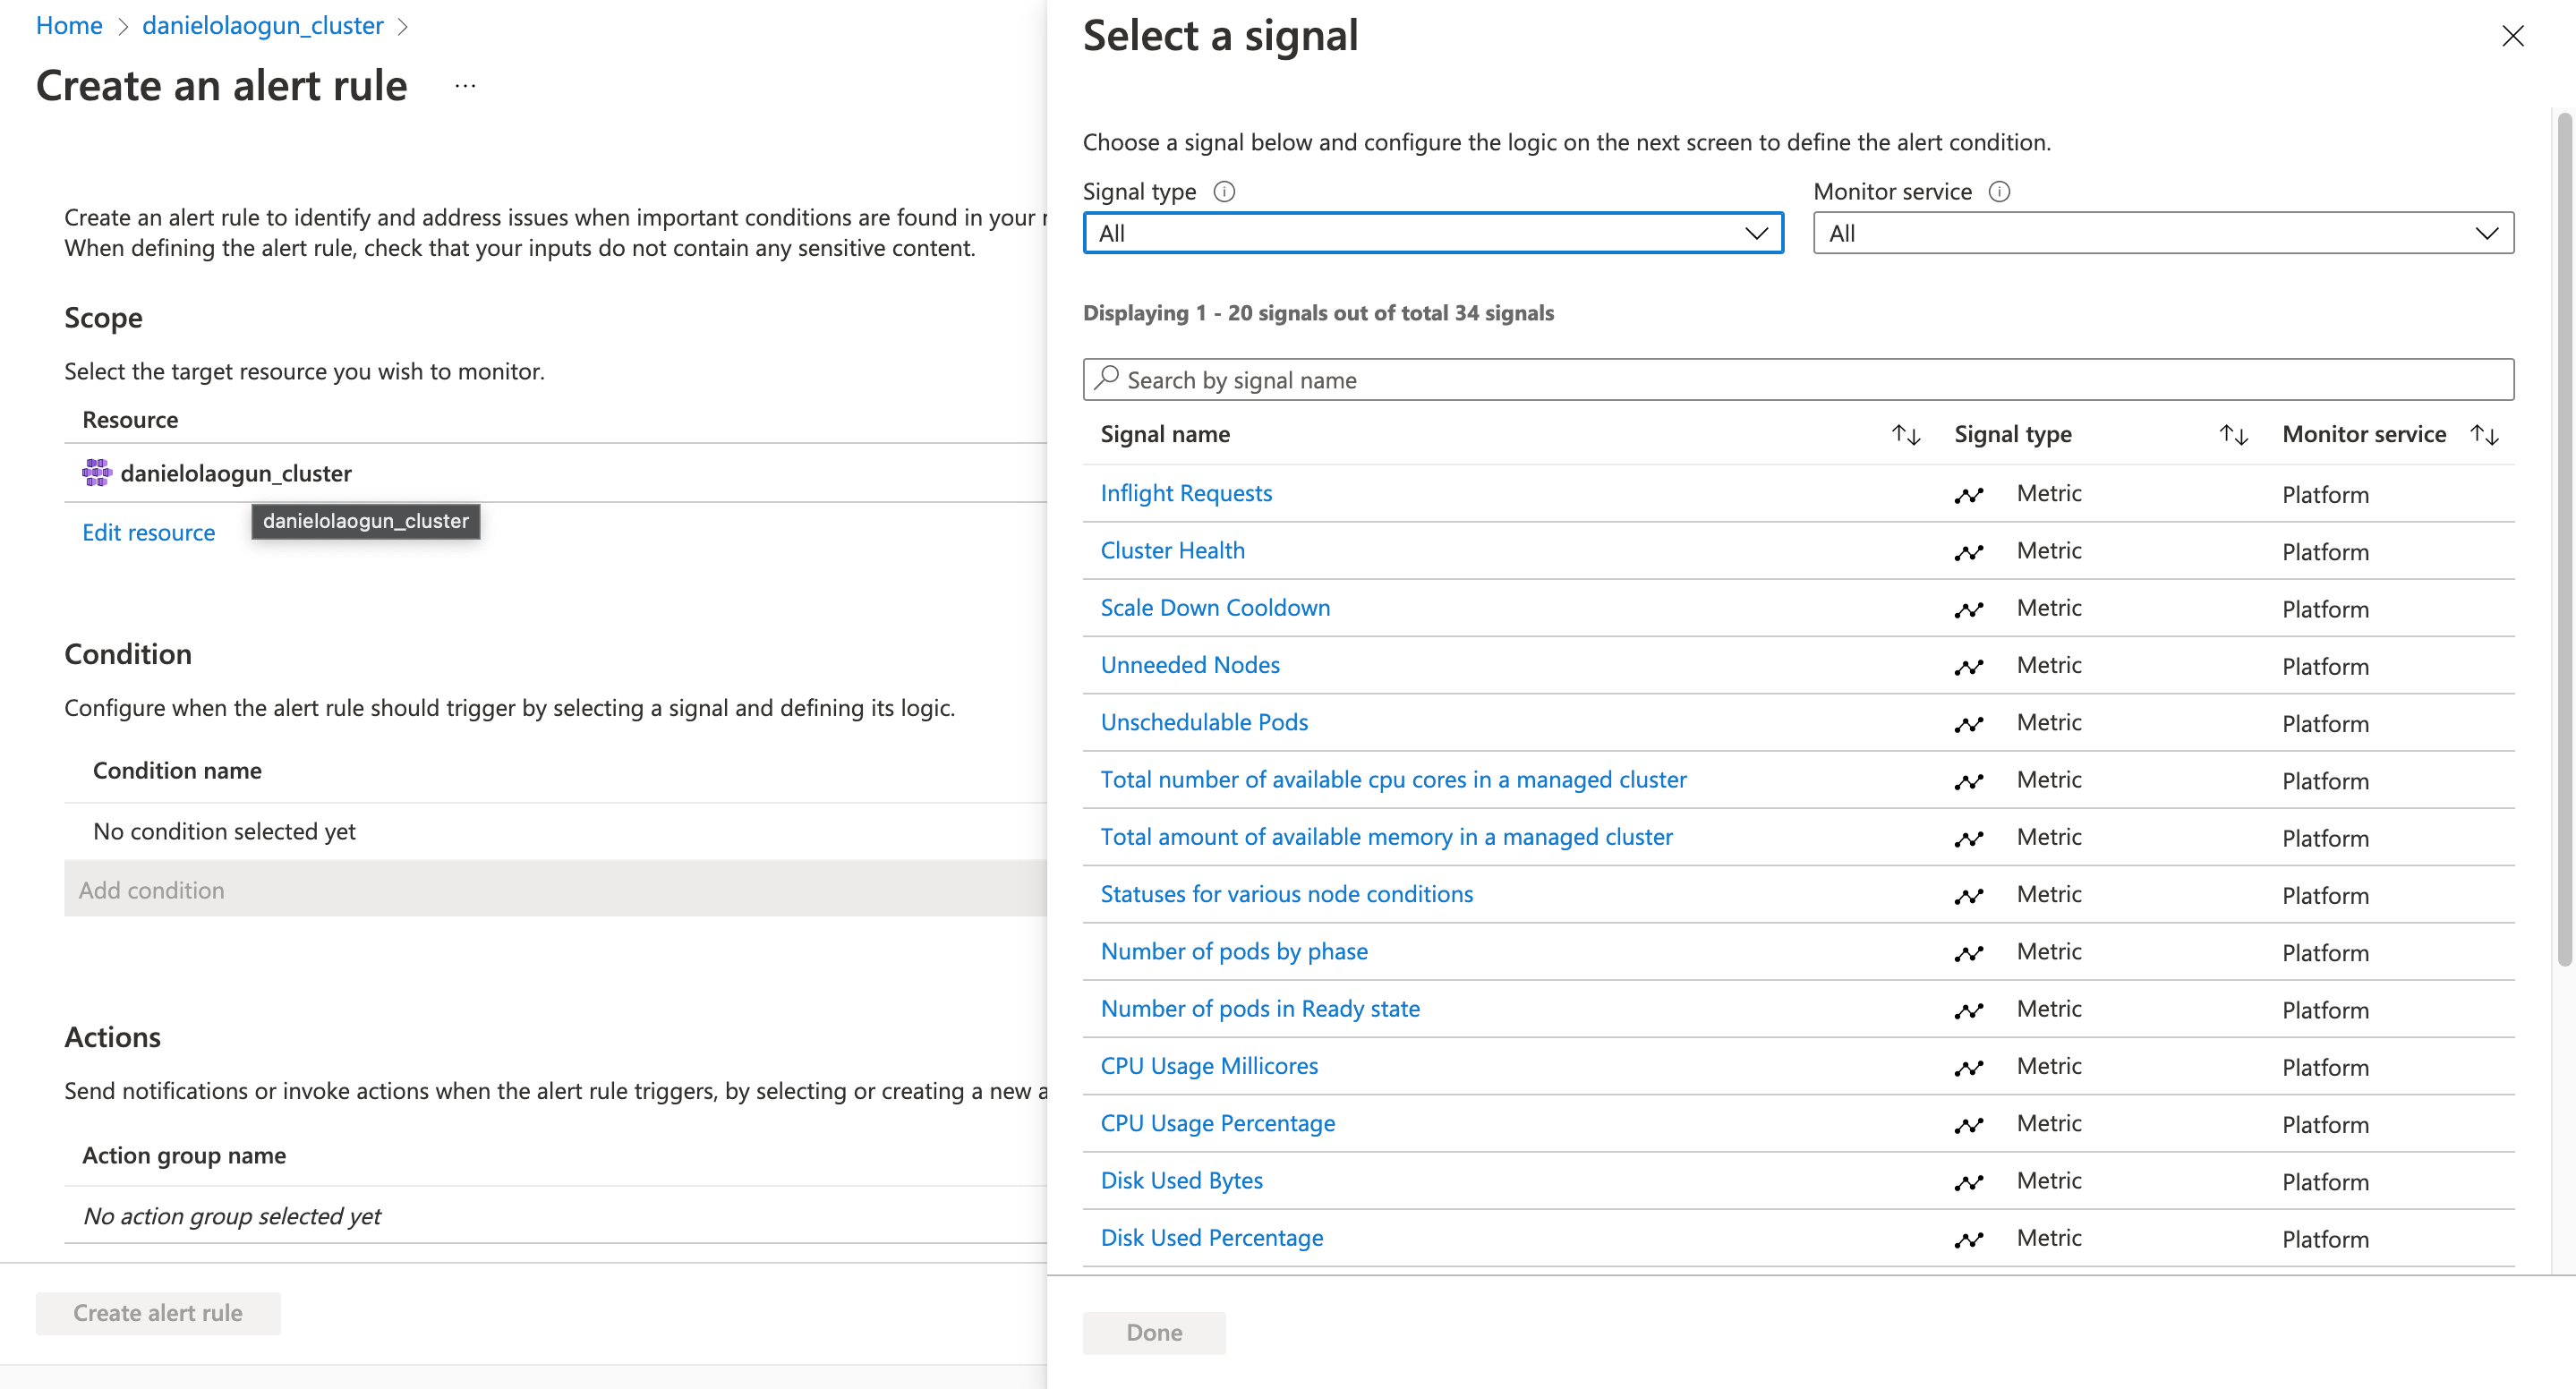
Alerts
The Alerts page lets you configure notifications for certain events that occur in your cluster. For example, you can configure an alert to notify you when your cluster resources consumption, like CPU or memory consumption, reaches the 95 percent mark.
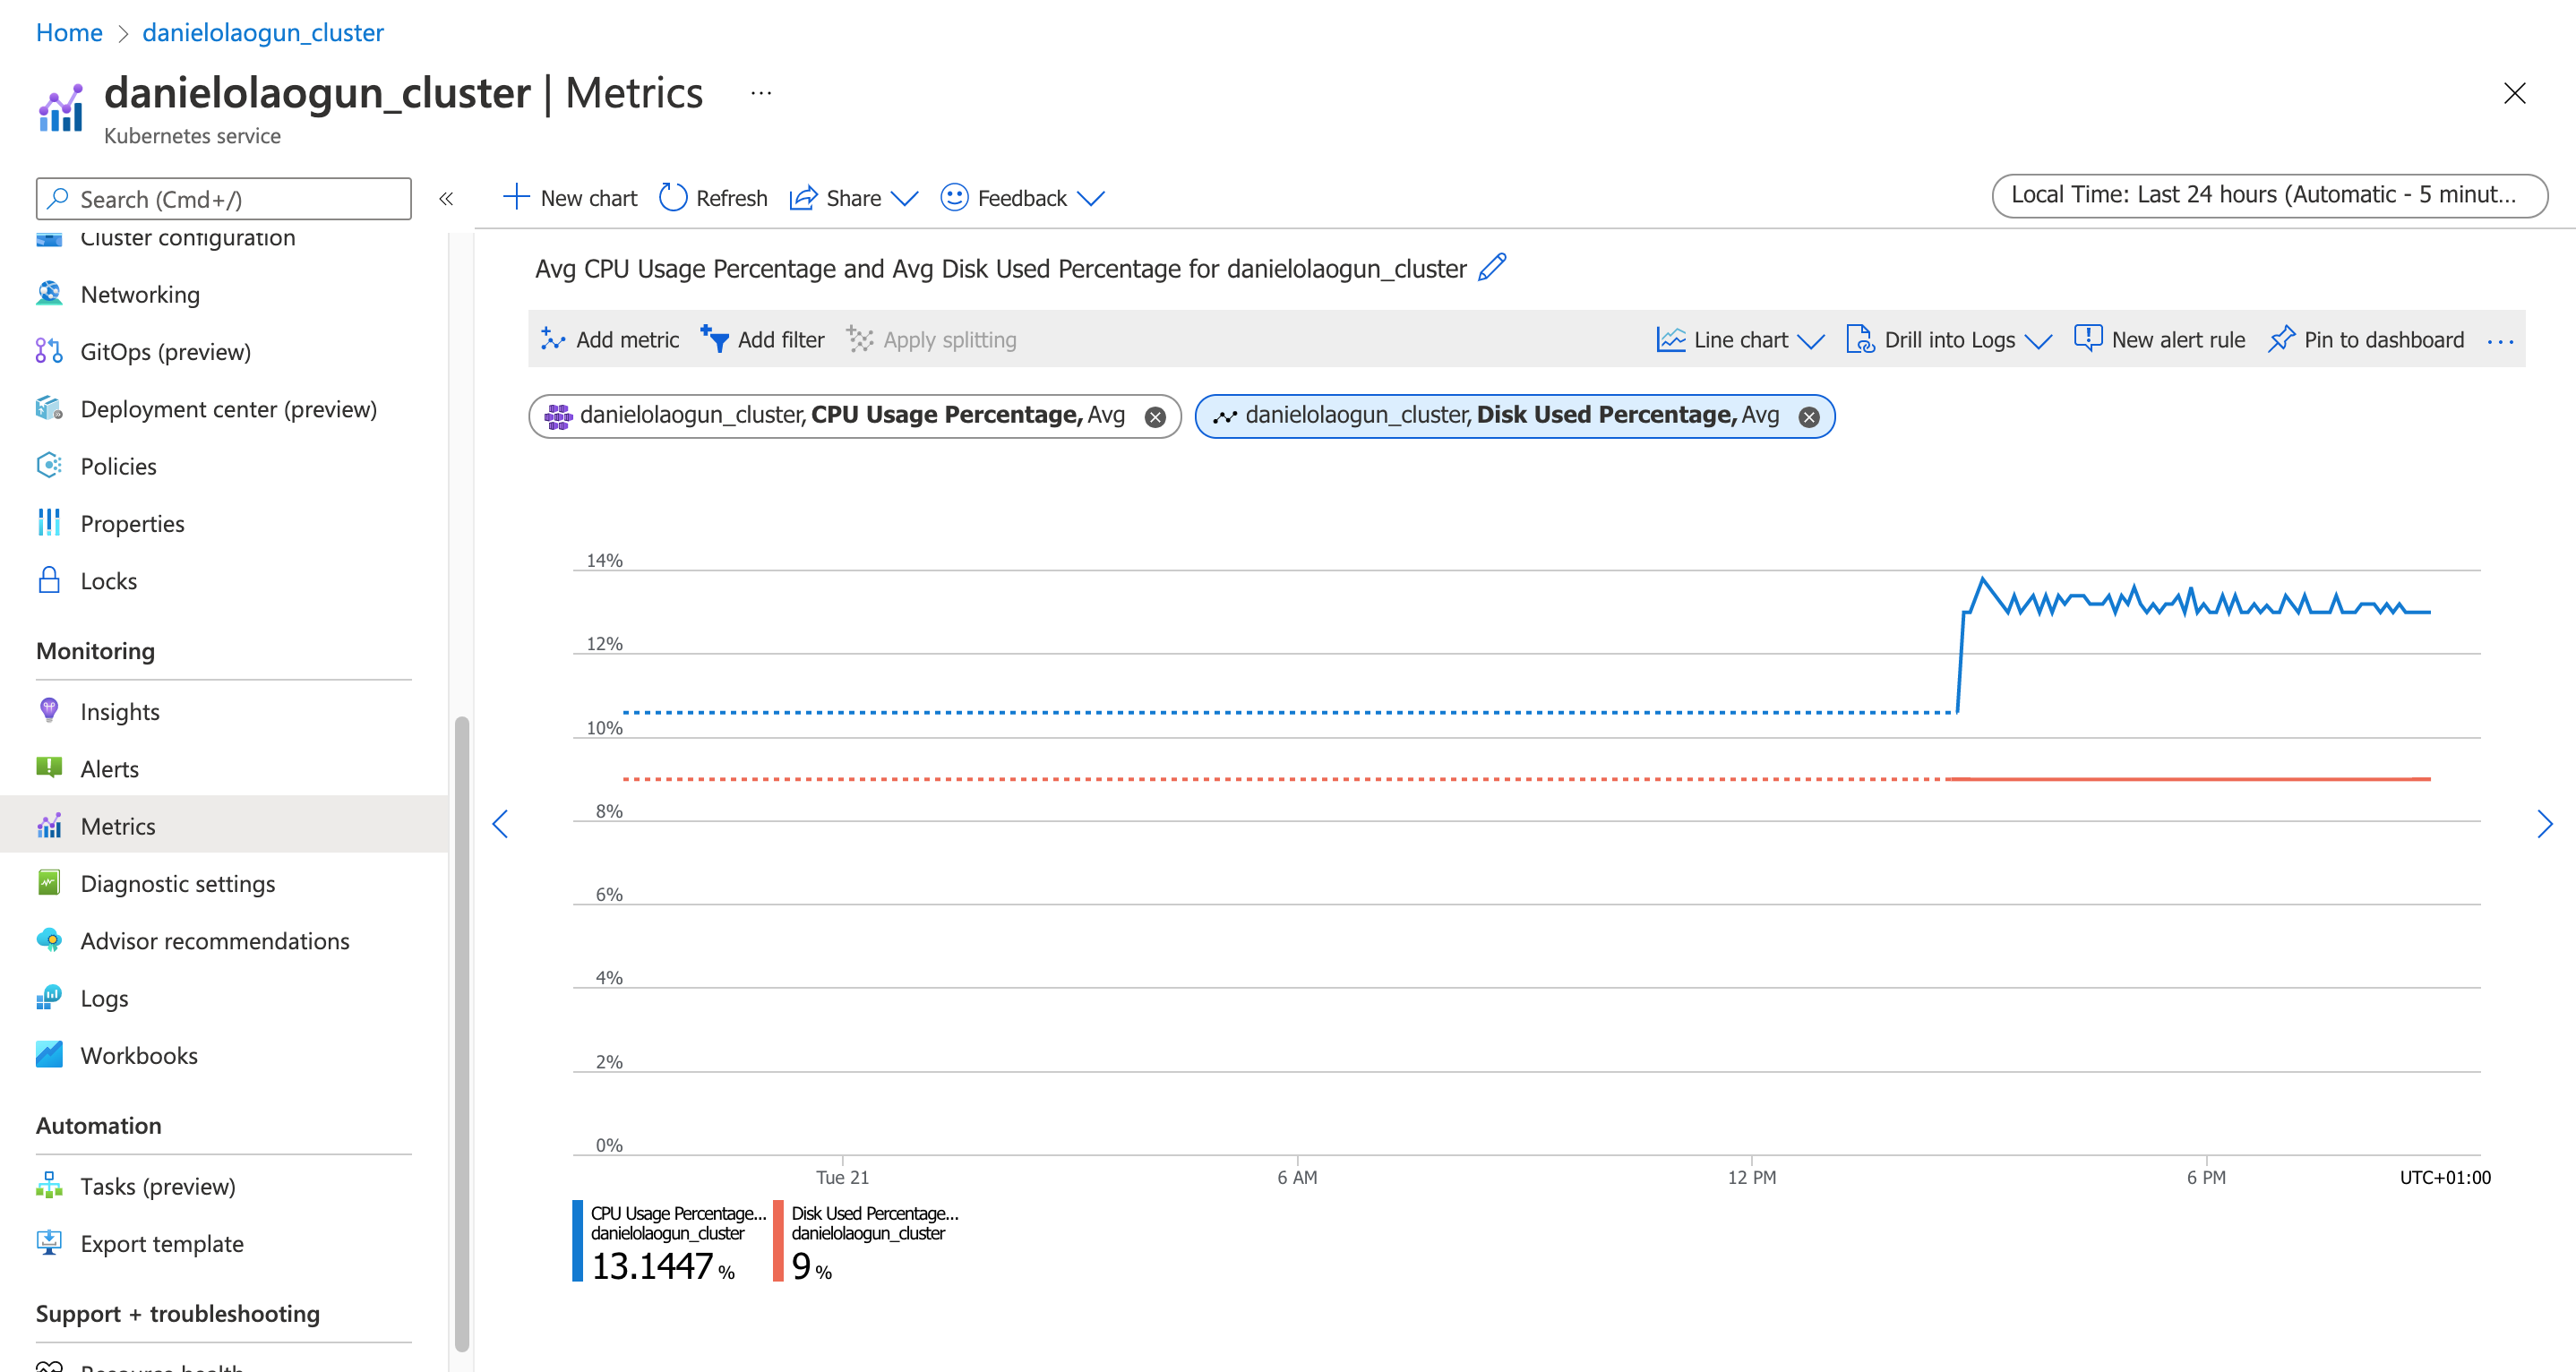
Metrics
The Metrics page displays a time series reporting of different components and resources in your cluster. For example, you can view a time series of the percentage usage of your CPU resources. Or you can view the ready state of your cluster pods across a period of time.
The Metrics page lets you view different cluster metrics in a bar chart, line chart, area chart, and so forth, and allows you to view multiple reports at once.
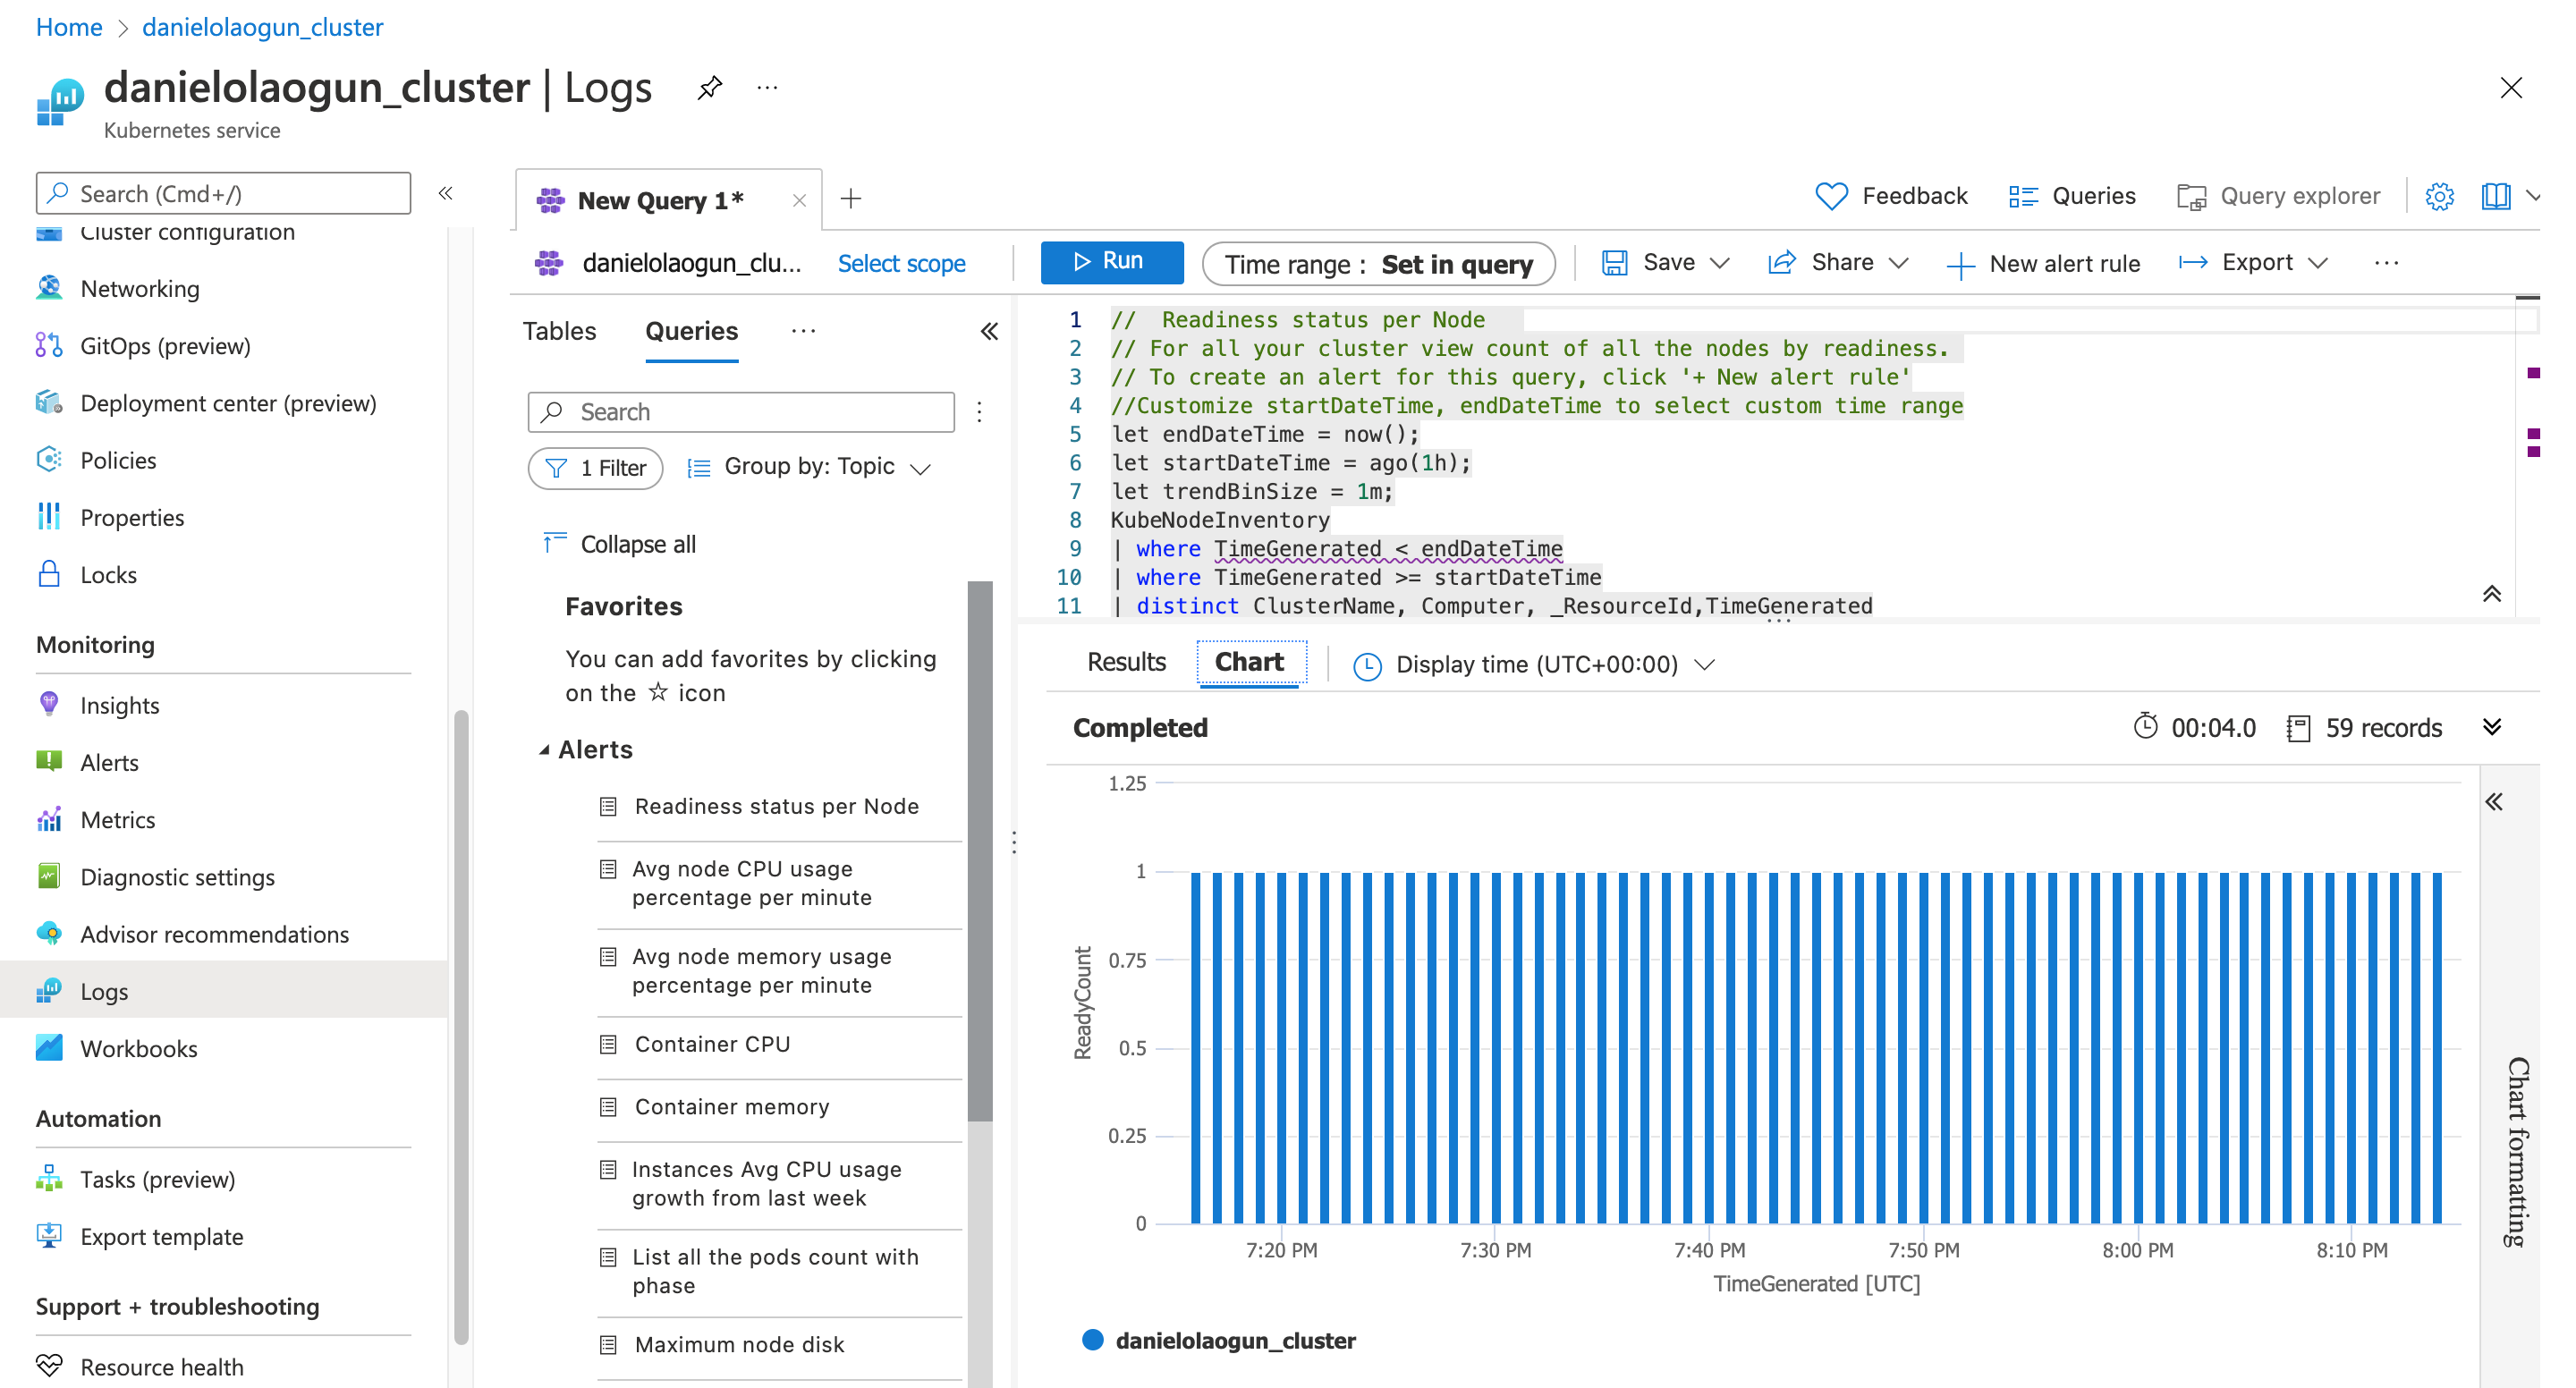
Logs
Azure Monitor Logs collects data from your Kubernetes components and resources. These logs, generated from your nodes, pods, containerized applications, and Kubernetes control plane, can be viewed and analyzed on the Logs page. This page has a sophisticated query analyzer that lets you quickly analyze millions of records.
This feature lets you analyze your logs, configure alert rules, visualize your logs, and more.
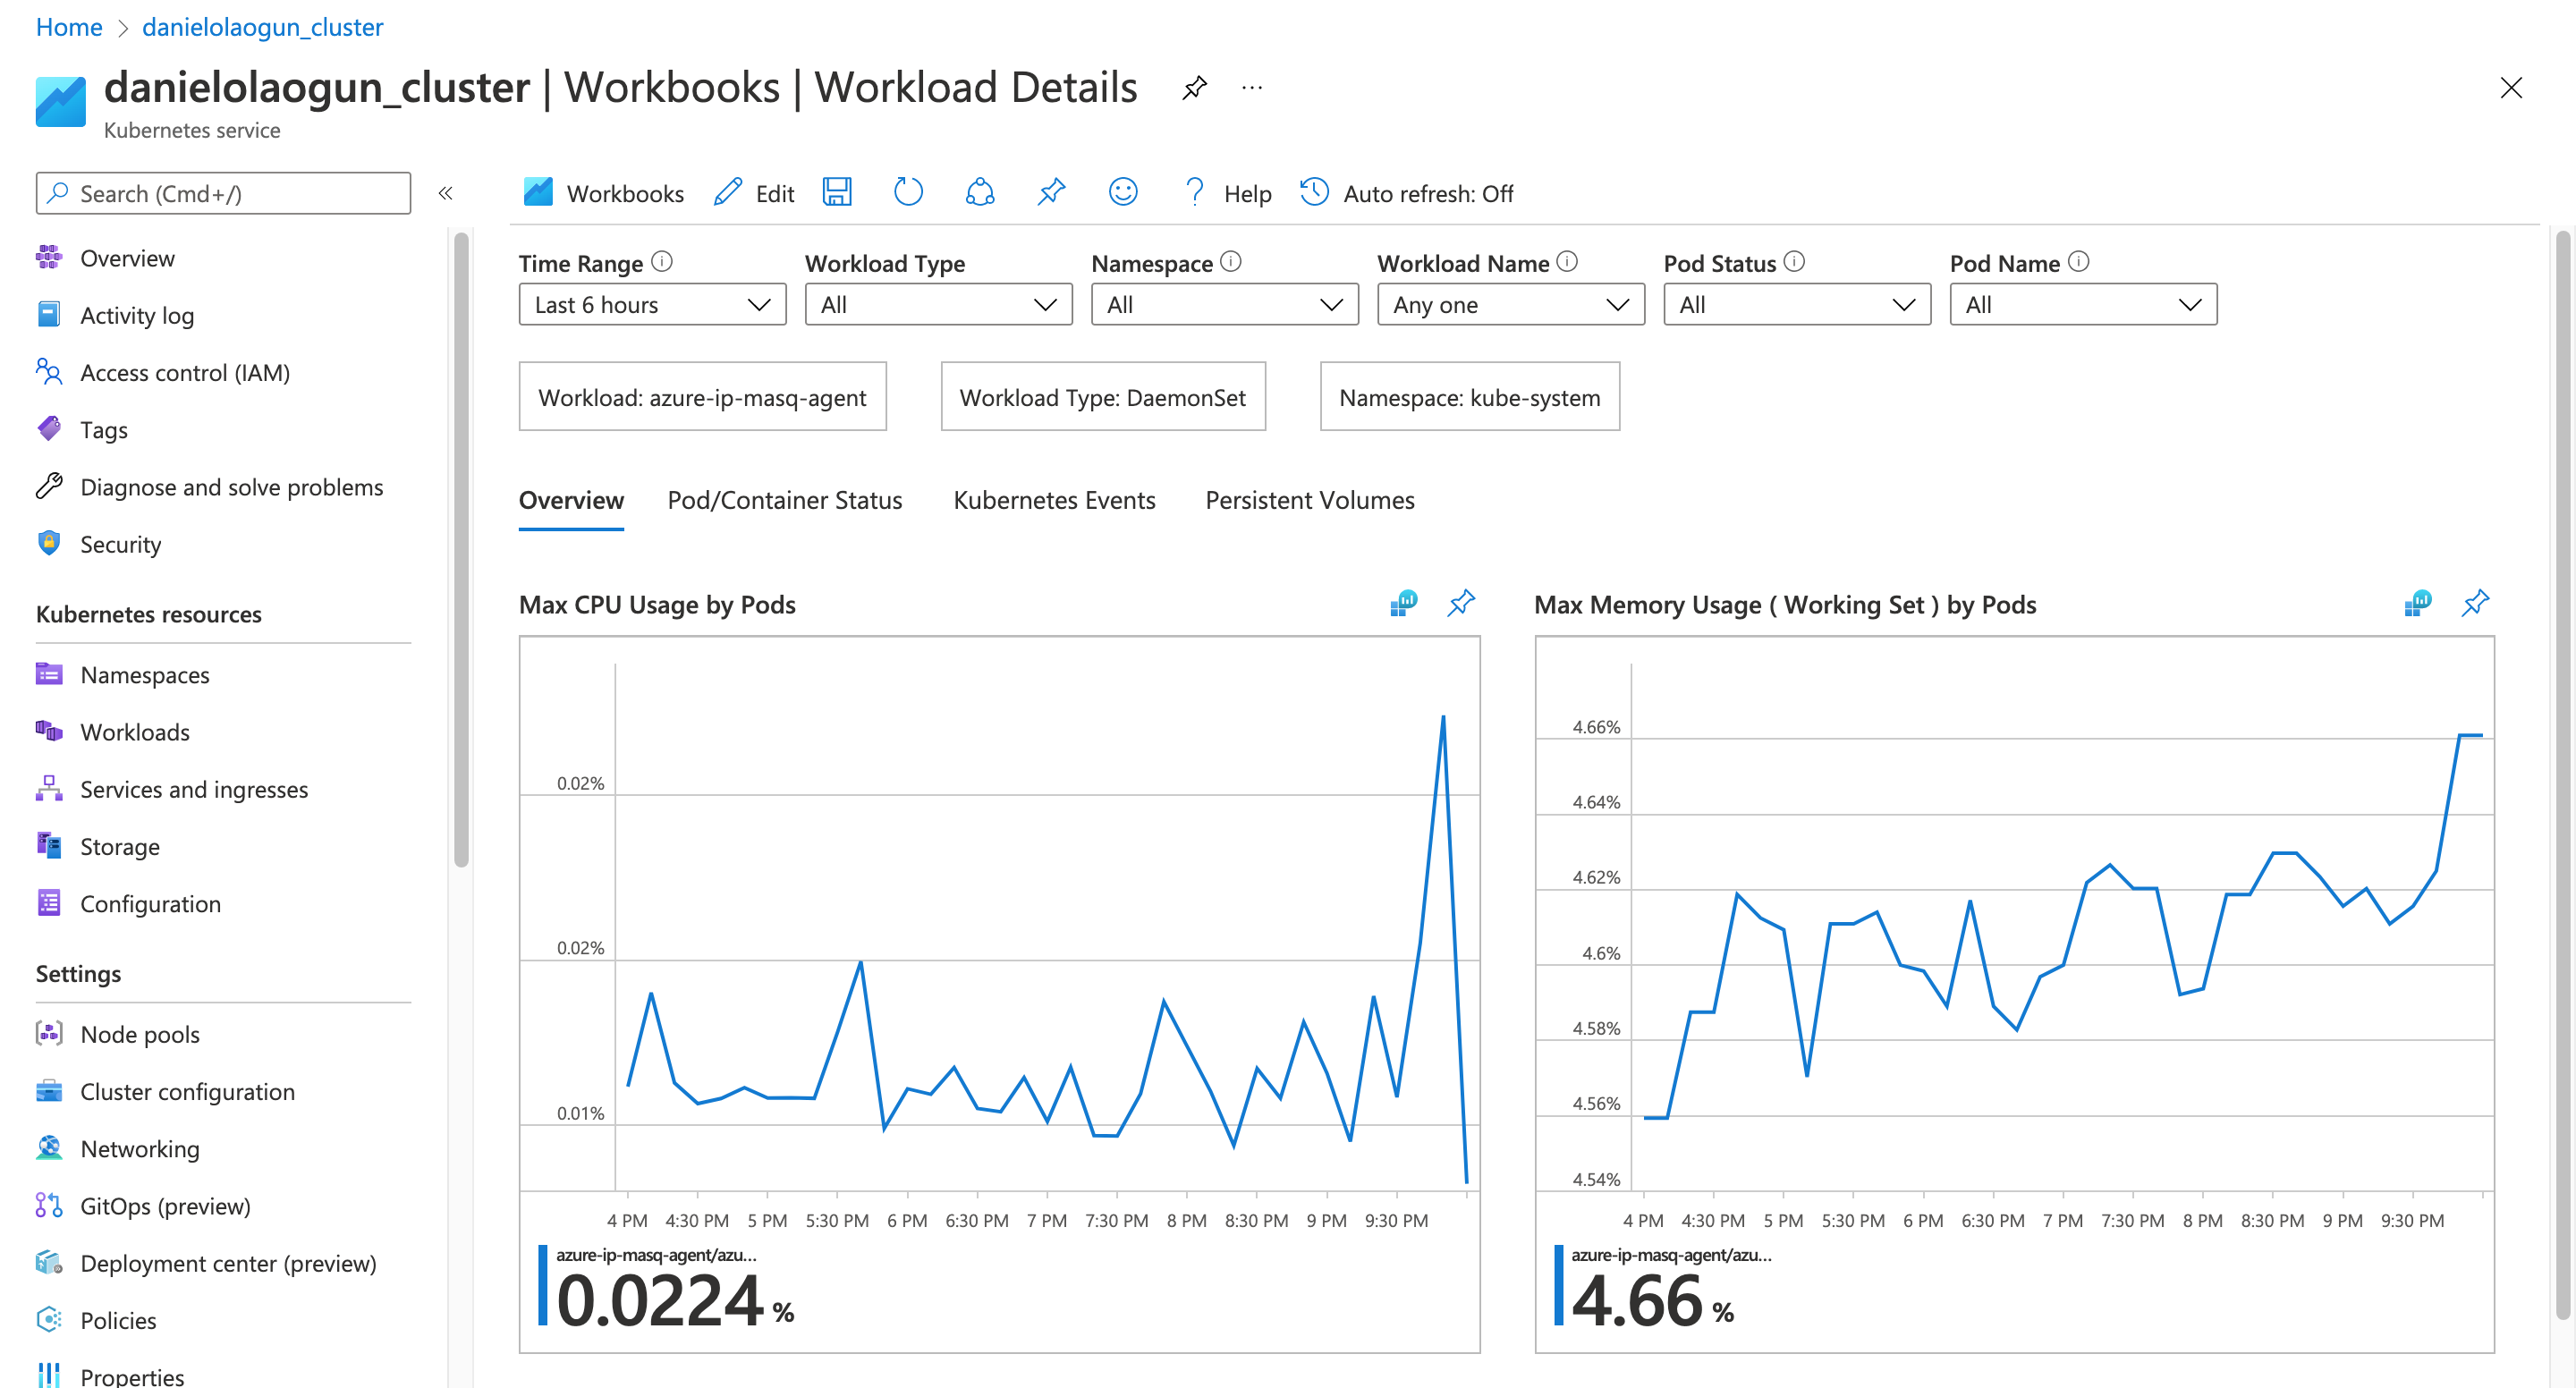
Workbooks
Workbooks allow you to create rich data visualization reports for your cluster resources.

Azure Monitor cost
The Azure Monitor pricing page lets you view the cost of using the service based on your region. It also offers different pricing tiers, like the Pay-As-You-Go and Commitment Tiers, for log data ingested into your Azure Monitor.
If you want an estimate of your potential costs for Azure Monitor, you can visit the Pricing calculator page and calculate your bill based on the functionalities you’ll be using.
Microsoft Defender for Cloud
Microsoft Defender for Cloud, formerly Azure Defender, is a security monitoring tool for your AKS Kubernetes cluster. Whenever new global threats are discovered in your cluster, it alerts you so that you can perform the necessary actions to mitigate the threats.
Microsoft Defender for Cloud monitors your Kubernetes dashboard for threats, monitors the creation of high-privileged roles, and protects your nodes and clusters. The AKS documentation includes more insights on how to enable Microsoft Defender for your cluster.
Managed Prometheus with Azure Monitor
Prometheus is a time series system and monitoring database. It pulls data and metrics from your AKS Kubernetes cluster for monitoring, analysis, and visualization. It’s similar to Azure Monitor, but it provides a broader scope of data metrics and logs, like pulling requests and response rates of your application from the ingress controller over a period. It can also absorb data quickly from different sources in your cluster, which makes it tailor-made for complex workloads.
Azure provides the ability to extend the monitoring capabilities of Azure Monitor with the easy integration of Prometheus without installing the Prometheus server. The Azure Monitor documentation provides guidance on how to configure Prometheus with Azure Monitor. Learn more about managed Prometheus as a service here.
Final thoughts
Monitoring your AKS cluster is important for the performance of your cluster and application.
In this article, you learned what the different options are for monitoring a Kubernetes cluster deployed using AKS and how to enable Azure Monitor in your AKS cluster and enhance it with Prometheus.
If you're looking to build a monitoring dashboard to manage your applications in real-time, then try using Airplane. With Airplane, you get a code-first, maintenance-free platform to quickly build custom internal tools. The basic building blocks of Airplane as Tasks, which are functions that anyone on your team can use. Airplane also offers Views, a React-based platform for creating custom UIs.
To build your first monitoring dashboard using Views, sign up for a free account or book a demo.


